8 | Raymarine Interim Sheet |
|
|
Other Vessel Tracking works in conjunction with the Position Reporting system, enabling the navigator or racer to monitor the positions of other vessels traveling in company or under race conditions. It is accessed by clicking on the Tools menu and selecting Other Vessel Tracking.
DataTrak Enhancements
The DataTrak module is a
Navigator 4.1 now allows for the display of DataTrak wand times. When capturing data from the DataTrak, vertical frames can be inserted in the chart delineating start and end points for the data capture. These lines, called wands, represent a particular segment of time on the graph. The time interval is reported at the top of the graph, in the blue status bar.
Animation Enhancements
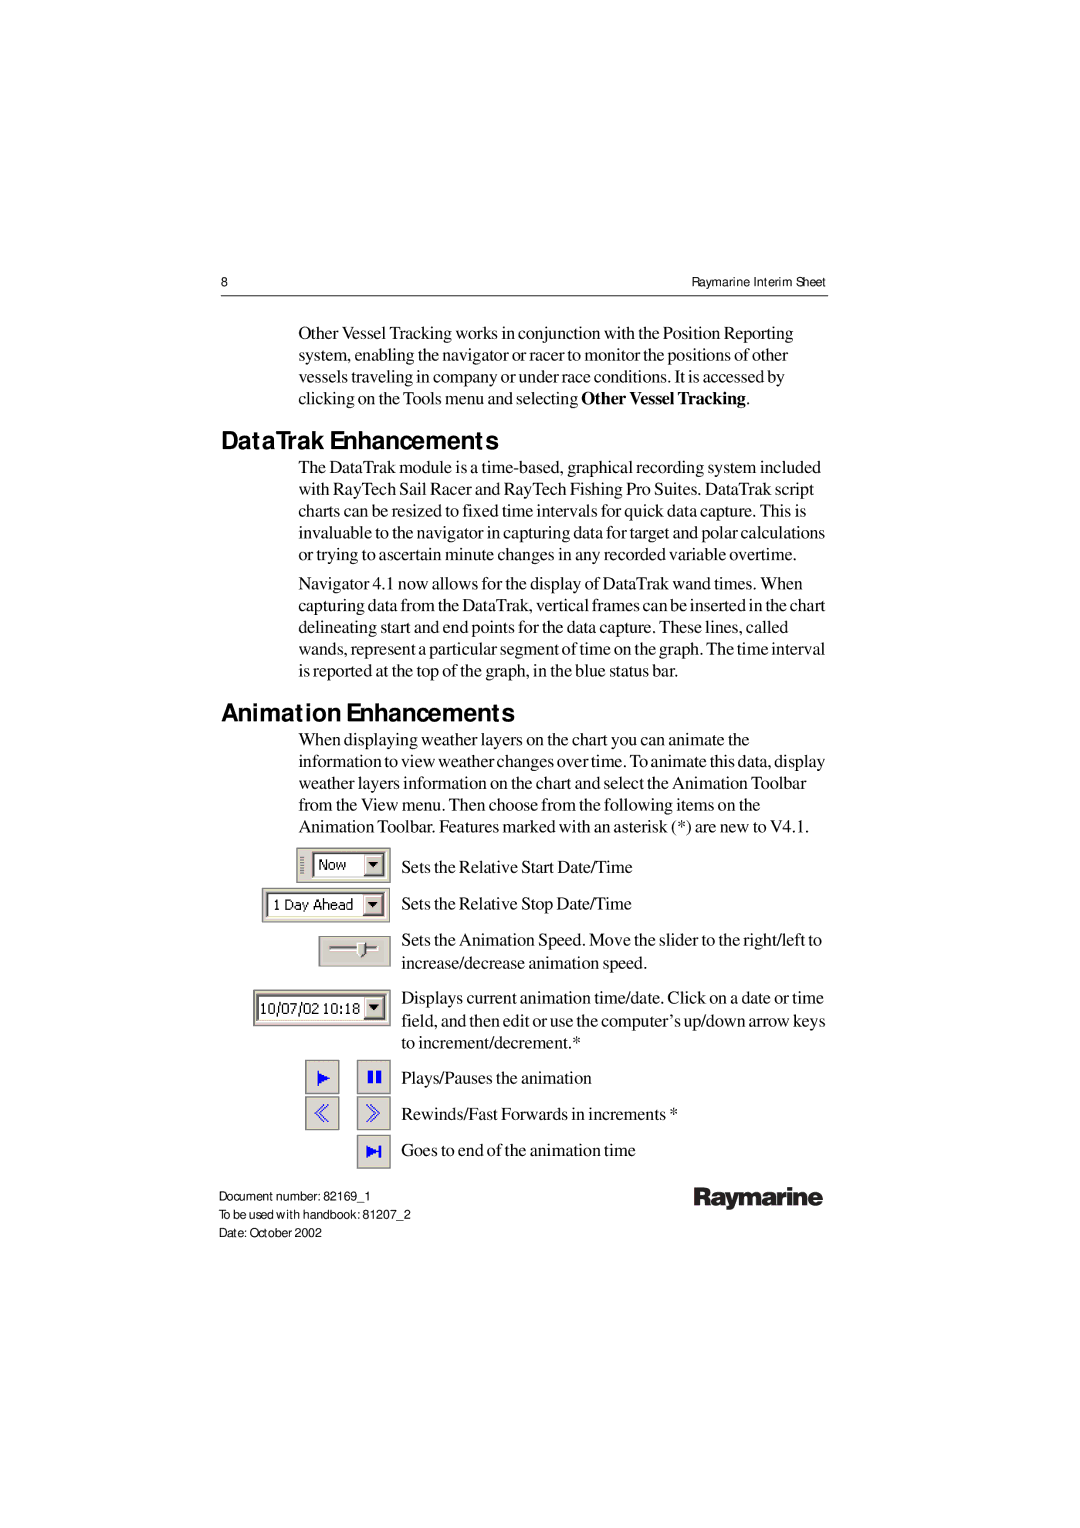
When displaying weather layers on the chart you can animate the information to view weather changes over time. To animate this data, display weather layers information on the chart and select the Animation Toolbar from the View menu. Then choose from the following items on the Animation Toolbar. Features marked with an asterisk (*) are new to V4.1.
Sets the Relative Start Date/Time
Sets the Relative Stop Date/Time
Sets the Animation Speed. Move the slider to the right/left to increase/decrease animation speed.
Displays current animation time/date. Click on a date or time field, and then edit or use the computer’s up/down arrow keys to increment/decrement.*
Plays/Pauses the animation
Rewinds/Fast Forwards in increments *
Goes to end of the animation time
Document number: 82169_1
To be used with handbook: 81207_2
Date: October 2002
