RayTech Navigator User’s Guide
Using the Upwind, Downwind, and Vmc Plot Screens
The Upwind, Downwind, and Vmc Plot (Velocity Made good on Course) screens enable you to directly analyze those aspects of the Polar plot by reducing the display content to only those elements.
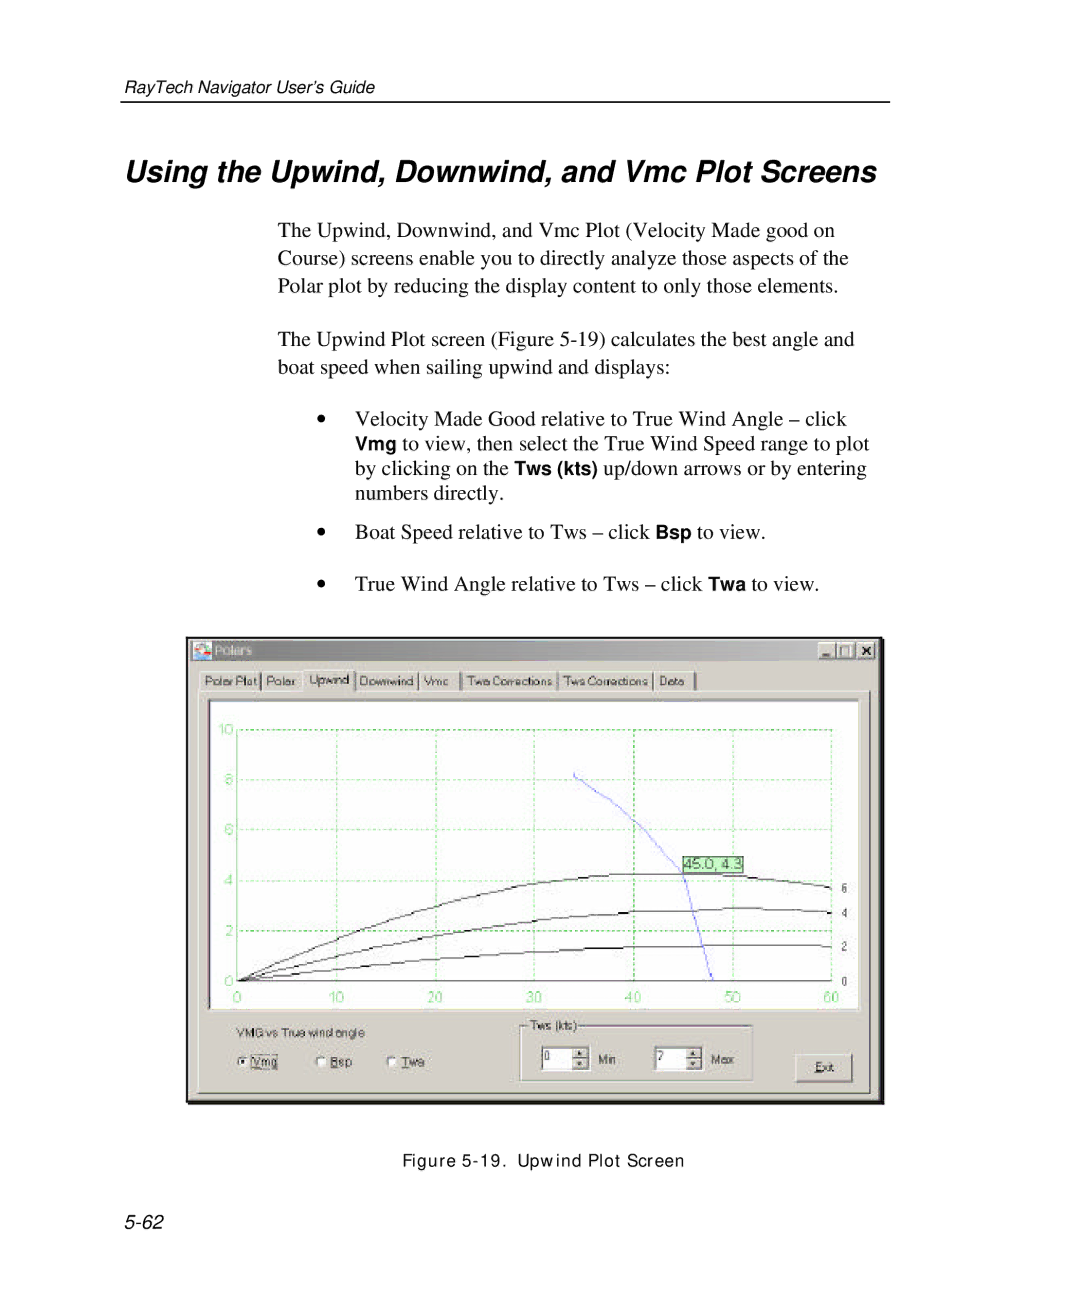
The Upwind Plot screen (Figure
∙Velocity Made Good relative to True Wind Angle – click Vmg to view, then select the True Wind Speed range to plot by clicking on the Tws (kts) up/down arrows or by entering numbers directly.
∙Boat Speed relative to Tws – click Bsp to view.
∙True Wind Angle relative to Tws – click Twa to view.