Advanced Navigator Functions
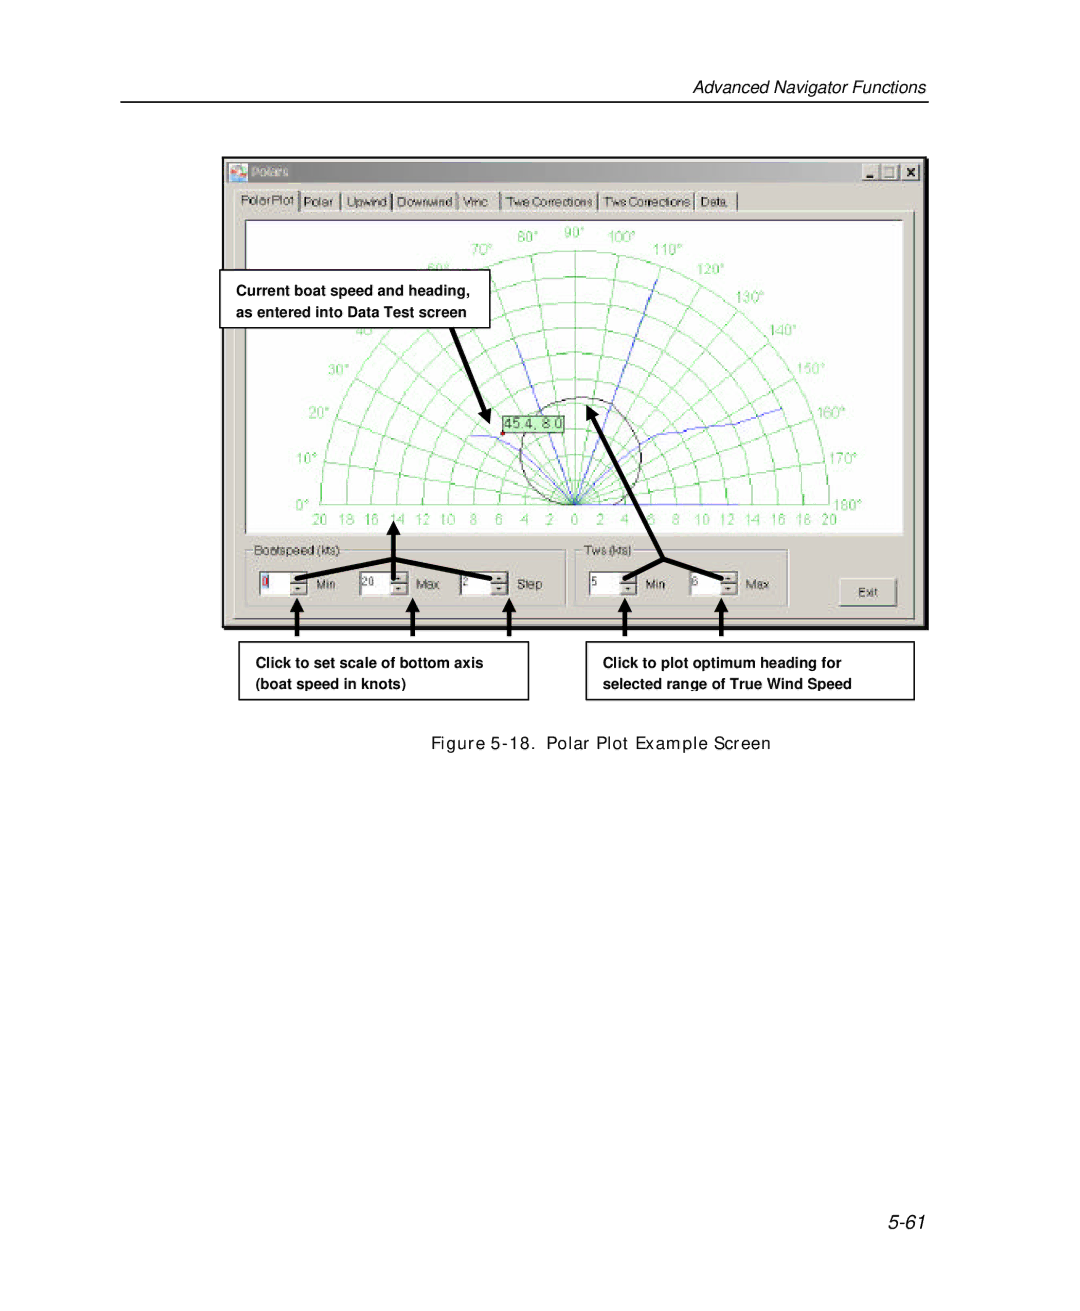
Current boat speed and heading, as entered into Data Test screen
Click to set scale of bottom axis (boat speed in knots)
Click to plot optimum heading for selected range of True Wind Speed
Current boat speed and heading, as entered into Data Test screen
Click to set scale of bottom axis (boat speed in knots)
Click to plot optimum heading for selected range of True Wind Speed