Measurement Uncertainty Analysis – Power Reference Level Test
Measurement Introduction
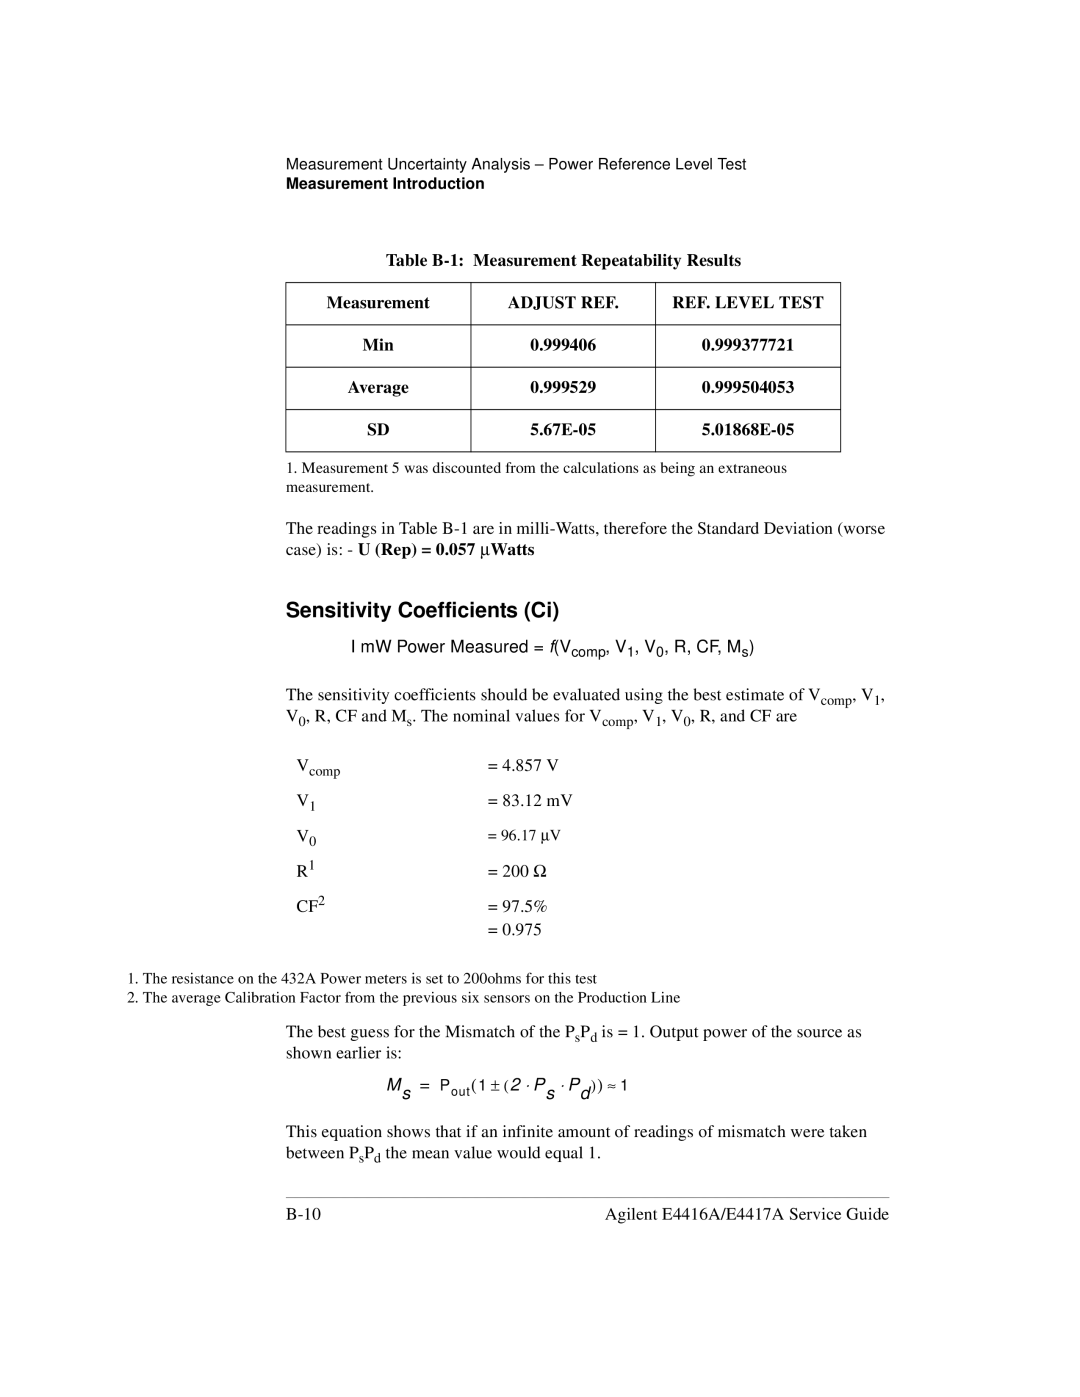
Table B-1: Measurement Repeatability Results
Measurement | ADJUST REF. | REF. LEVEL TEST |
|
|
|
Min | 0.999406 | 0.999377721 |
|
|
|
Average | 0.999529 | 0.999504053 |
|
|
|
SD |
|
|
|
|
|
1.Measurement 5 was discounted from the calculations as being an extraneous measurement.
The readings in Table
Sensitivity Coefficients (Ci)
I mW Power Measured = f(Vcomp, V1, V0, R, CF, Ms)
The sensitivity coefficients should be evaluated using the best estimate of Vcomp, V1, V0, R, CF and Ms. The nominal values for Vcomp, V1, V0, R, and CF are
Vcomp | = 4.857 V |
V1 | = 83.12 mV |
V0 | = 96.17 ∝V |
R1 | = 200 Ω |
CF2 | = 97.5% |
=0.975
1.The resistance on the 432A Power meters is set to 200ohms for this test
2.The average Calibration Factor from the previous six sensors on the Production Line
The best guess for the Mismatch of the PsPd is = 1. Output power of the source as shown earlier is:
Ms = Pout(1 ± (2 ⋅ Ps ⋅ Pd)) ≈ 1
This equation shows that if an infinite amount of readings of mismatch were taken between PsPd the mean value would equal 1.
Agilent E4416A/E4417A Service Guide |
