TYPES OF VLANS
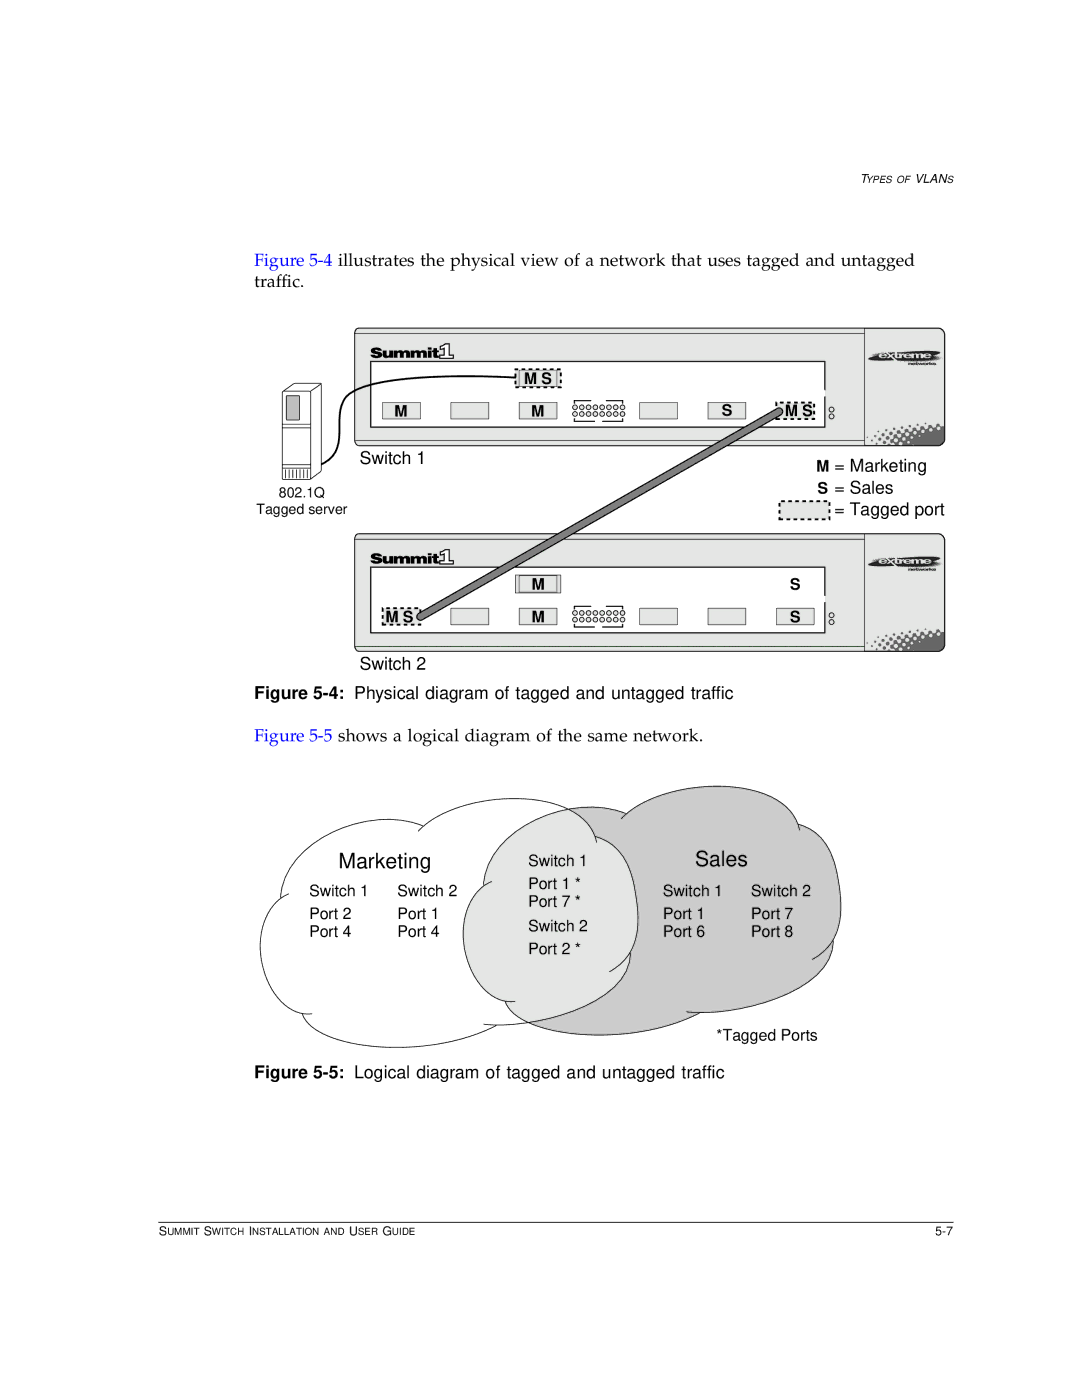
Figure 5-4 illustrates the physical view of a network that uses tagged and untagged traffic.
M
M S |
M
S
M S
|
|
|
|
|
|
|
|
|
| Switch 1 | M = Marketing | |
|
|
|
|
|
|
|
|
|
|
| ||
|
|
|
|
|
|
|
|
|
|
| ||
802.1Q |
| S = Sales | ||||||||||
Tagged server |
|
| = Tagged port | |||||||||
M S
M |
M |
S |
S
Switch 2
Figure 5-4: Physical diagram of tagged and untagged traffic
Figure 5-5 shows a logical diagram of the same network.
Marketing | Switch 1 | Sales |
| ||
Switch 1 | Switch 2 | Port 1 * | Switch 1 | Switch 2 | |
Port 7 * | |||||
Port 2 | Port 1 | Port 1 | Port 7 | ||
Switch 2 | |||||
Port 4 | Port 4 | Port 6 | Port 8 | ||
| |||||
Port 2 *
*Tagged Ports
Figure 5-5: Logical diagram of tagged and untagged traffic
SUMMIT SWITCH INSTALLATION AND USER GUIDE |