Version 4.2.2 for Unix
3Com Corporation 5400 Bayfront Plaza Santa Clara, California
Contents
Using the ATM and Vlan Management Application
Color Status and Propagation 6
Vlan Moves 5 Moving Ethernet Segments Between VLANs
LEC 7 Lane User 7 Switch Domain Statistics
Tracing a VC Path Between Two ATM End Nodes 6
Lane Component Statistics
Glossary Index
Viii
How to Use
Introduction
This Guide
Organization of the ATM and Vlan Management User Guide
Conventions
List conventions that are used throughout this guide
Text Conventions
Equipment
About this Guide
ATM and Vlan Manager
14CHAPTER
Management?
What is ATM
ATM and Vlan
Management
Vlan Management Functions
Tools Assistants or Wizards
What is ATM and Vlan Management?
ATM and Vlan
Management Maps
Map
1ATM Device Manager Map
2ATM Switch Graph Assistant Window
Zoom icon Cross Reference icon
4ATM Network Map Main Display
5ATM Switch Map
LAN Emulation provides
6Access to the ATM Network Map through the Topology Browser
7LAN Emulation Map Main Display
8LAN Emulation Submap/Backbone and Services Window
ATM and Vlan Management Maps
10The Virtual LANs Map Main Display
Virtual LANs Map
11The Virtual LANs Submap Displaying Ethernet Segments
16CHAPTER 1 ATM and Vlan Management Overview
13The ATMvLAN Policies Map
14Access to the ATMvLAN Policies Map using the Topology Tool
15The ATM and Vlan Gigabit Network Map
ATM and Vlan Application Toolbar, see page 1-21, includes
Management Tools
Http//machineipaddress/7689/WebBase
Icon Display Icon Name Description
17The ATMvLAN Toolbar
Topology Tool
24CHAPTER 1 ATM and Vlan Management Overview
ATM and Vlan Management Tools
26CHAPTER 1 ATM and Vlan Management Overview
Topology Tool ATMvLAN Objects Toolbar
See for a detailed description of the Bandwidth Tool
Bandwidth Tool
Report Tool
19The Network Node Interface Traffic Tools
Locator Tool
20The Network Node Interface Tabular Tool
Users Tool
21The Locator Tool
22The Build UDB Tool
23The VnPro Tool
Profile Tool
24VnPRo Save As dialog box
ATM and Vlan Management Tools
Tasks Tool
FSetup Tool
26Fast Setup Wizard Step
27Fast Setup Wizard Step
28Fast Setup Wizard Step
29Fast Setup Wizard Step
30Fast Setup Wizard Step
31Fast Setup Wizard Step
NMS Setup
34NMS Setup Delegation PDP
Click Next. is displayed as in Figure
46CHAPTER 1 ATM and Vlan Management Overview
37NMS Setup Locator
Management
Configuration
Assistants
Assistants
NMSetup
Values in a step by step procedure
NMSetup
Devices
To configure the Snmp SmartAgents on Devices
Device Snmp Community Setting
1Configuring Snmp Community Settings
Starting the Poller on Multiple Distributed Machines
Starting the Poller Locally
Configuring Snmp SmartAgents on Devices
An Example of Distributed Polling
Device
Configuration for
VLANs in ATM
Networks
CB7000 Fast Setup Tool
Virtual LANs
Vlans in Non-ATM
Starting Up
Login to the Unix Workstation and Start the OVW
Manager
Management Application
Common Startup Problems
Verify that your network is up and running
Customize the Vlan colors and aliases
3Virtual LANs Configuration Assistant
Filename Description
2ATMvLAN Customization Files
Restart the ATM Vlan Application
Select ATMvLAN -- Load Transcend ATMvLAN Maps
Page
Vlan Maps
Navigating ATM
Window Name Select Action Description
1Window Access From the Root Window
Coded according to its current status in the network
2Window Access from the ATMvLAN Devices Map
3SuperStack II Switch
4CoreBuilder Front Panel Display
5CoreBuilder 2500 Module Device Manager Front Panel Display
6ATM SuperStack II Switch 2700 Array
Window Name Select Action
8The VN-elan window 4Window Access from the Vn-elan Map
9Cross Referencing VLANs in the Transcend Topology Browser
Lane User Double click, or from
LES
ATM Network ATM Switch Double click, or from
ATMvLAN menu select the Move Newly assigned policy Icon
13The ATMvLAN Toolbar
Manual Device Discovery Configuration Assistant
Backbone and Services Configuration Assistant
Vlan Aliases and Colors Configuration Assistant
14This Window Displays the VC Path Between Two LE Clients
Data Direct
Using the ATM and Vlan Assistants
20CHAPTER 3 Using the ATM and Vlan Management Application
II Vlan Manager
22CHAPTER
Configuring
Manual Device
Discovery
2CHAPTER 4 Network Configuration Tasks
Manual Discovery window is displayed in Figure
1Manual Discovery Setup Window
Modifying Devices
Adding Devices
Deleting Devices
Clearing the Entire Database
2Locator Tool Manual Discovery Database
3The Backbone and Services Configuration Window
Click Apply
To access the Backbone and Services Configuration Assistant
8CHAPTER 4 Network Configuration Tasks
Lane Redundancy Planning and Setup Guidelines
Workaround
Pre-conditions for Lane Redundancy to Take Effect
LES Failure Resolution
Restoring Lane Clients To Use The Primary LES
How Does The Primary LES Regain Control of the ELAN?
Manually Modifying Lane Redundancy
Manually Returning the Clients LECs Back to the Primary LES
How Do Lane Clients Take Advantage of Multiple LECSs?
An Example of Setting Up and Activating Lane Redundancy
Configuring LAN Emulation Services
5The Backbone and Services Window
Configuring LAN Emulation Services
Lecs Recovery
Quick Lane Redundancy
Vlan Names field lists all the VLANs that have been defined
6Virtual LANs Configuration Assistant for Aliases and Colors
Viewing the Vlan Aliases and Colors Database
Retaining Vlan Aliases and Colors
Configuration in ATM based Vlan environments
Auto-configuration
Policy-based Vlan
Grouped together as a layer 2 broadcast domain
Stand-alone NT based Vlan Server
Integrated TEM/Unix or TEM/NT Based Vlan Server
Configuring MAC Based Vlan Auto-configuration Policy
8The Build UDB Tool
Finding a MAC Address
Using the MACvDB
Mapping a MAC Address to a Vlan
Searching the MACvDB
Modifying the MACvDB
Vlan
Configuring IP
Verify that Automatic Vlan Auto-configuration is Activated
Subnet-based Vlan
Configuring
Start the Locator Tool and select the SubnetVdb tab
Based policies
Modifying the Subnet
10The Locator Tool Subnet vDB
Moving Devices into the IP Subnet-based Policy
Networks
Configuring IP Subnet-based Vlan Auto-configuration
Server Member Table
Searching the Vlan Server Scalar Parameters
12The Locator Tool Vlan Server Member Table
Searching the Vlan Server Member Table
Administrative
Configuring or
LEC Configuration Parameter and Status Assistant
Viewing
13The LEC Configuration Dialog Box
Parameters Meaning
1Configuration Parameters
4LEC Configuration Window Actions
LE Server Parameters & Status Configuration Assistant
LES Status is
5LES Parameters
Window Actions
15The LsEthPort Parameters Configuration Assistant
Ethernet Port Parameters & Status Configuration Assistant
Port Status is
Port parameters are
ATM Port Parameters & Status
8Port Parameters
10Port Parameters
To access the window
12Window Actions
SuperStack II Switch 2700 Parameter and Status Information
Page
System information is
Chassis information is
CoreBuilder 7000 Module ATM Port Parameters & Status
16Port Parameters
18CoreBuilder Module ATM Port Parameters & Status
18Window Actions
17 Port Status
CoreBuilder 7000 Module Parameter and Status Information
19CoreBuilder Parameter and Status Configuration Assistant
19System Information
20Chassis Information
21 Window Actions
CoreBuilder 7000 Module Switch Board Parameters & Status
22Module Parameters
Module Status is
23Module Status
24Window Actions
Locate the ATM Devices
Display Existing VCs
Establishing Permanent Virtual Channels
Pinpointing Channel Congestion
New PVC is displayed in the window
Interfaces located on two different Switch Domain windows
22The Virtual Path window
Configuring PVCs
62CHAPTER 4 Network Configuration Tasks
Moving Ethernet
Vlan Moves
Segments Between
VLANs
Using the Vlan Move Operation
Virtual LANs Window is displayed as in Figure
To locate Ethernet segments
2The VNname window
3The Vlan Move window
Using the LAN Emulation Window
Locating Ethernet Segments Using the Hpov Locate Option
Drag-and-Drop Ethernet Segments Between Vlan Windows
Drag-and-Drop on Front Panel Window
4SuperStack II Switch 2700 Front Panel Display
Removing a Port from a Protocol-based Vlan
Automatic Vlan Moves Based on Policies
Snooping
Configuration
Performing Policy-based Vlan Moves
Null Policy
ATM and Vlan Policies Map
Disabling Ports
Enabling
Manual Lecs
Database
Modification
Manual Lecs Database Modification
16CHAPTER 5 Network Modification Tasks
Color Status
Propagation
Vlan Management software
Device Level
Troubleshooting
Indicates operating statuses of the ATMvLAN Device icons
5000, CoreBuilder 2500/6000, LANplex 2016/5000
3Color Key for Lane Level
Lane Level
Troubleshooting icons
4Color Key for Network icons
5Color Key for Virtual LANs Icons
Indications in the Vlan Map
Indications in the Backbone and Services Window
Path Assistants for
Performance Problems
Identifying
Connectivity
End Nodes
8CHAPTER 6 Network Troubleshooting Tasks
Network Performance Measurement Tasks
1The NNIx Browser
NNIx Map
4CHAPTER 7 Network Performance Measurement Tasks
3The NNIx Configuration Map Tab
Map Configuration Tab
4The NNIx Polling Configuration Tab
NNIx Traffic Polling Configuration Tab
NNIx Communication Configuration Tab
Communication Configuration Tab
Simulation Configuration Tab
History Configuration Tab
Page
8The NNIx Bar Chart
10The NNIx Cumulative Pie Chart
Displaying Statistics To display statistics
11CoreBuilder Statistics
Level Statistics
Displaying Port
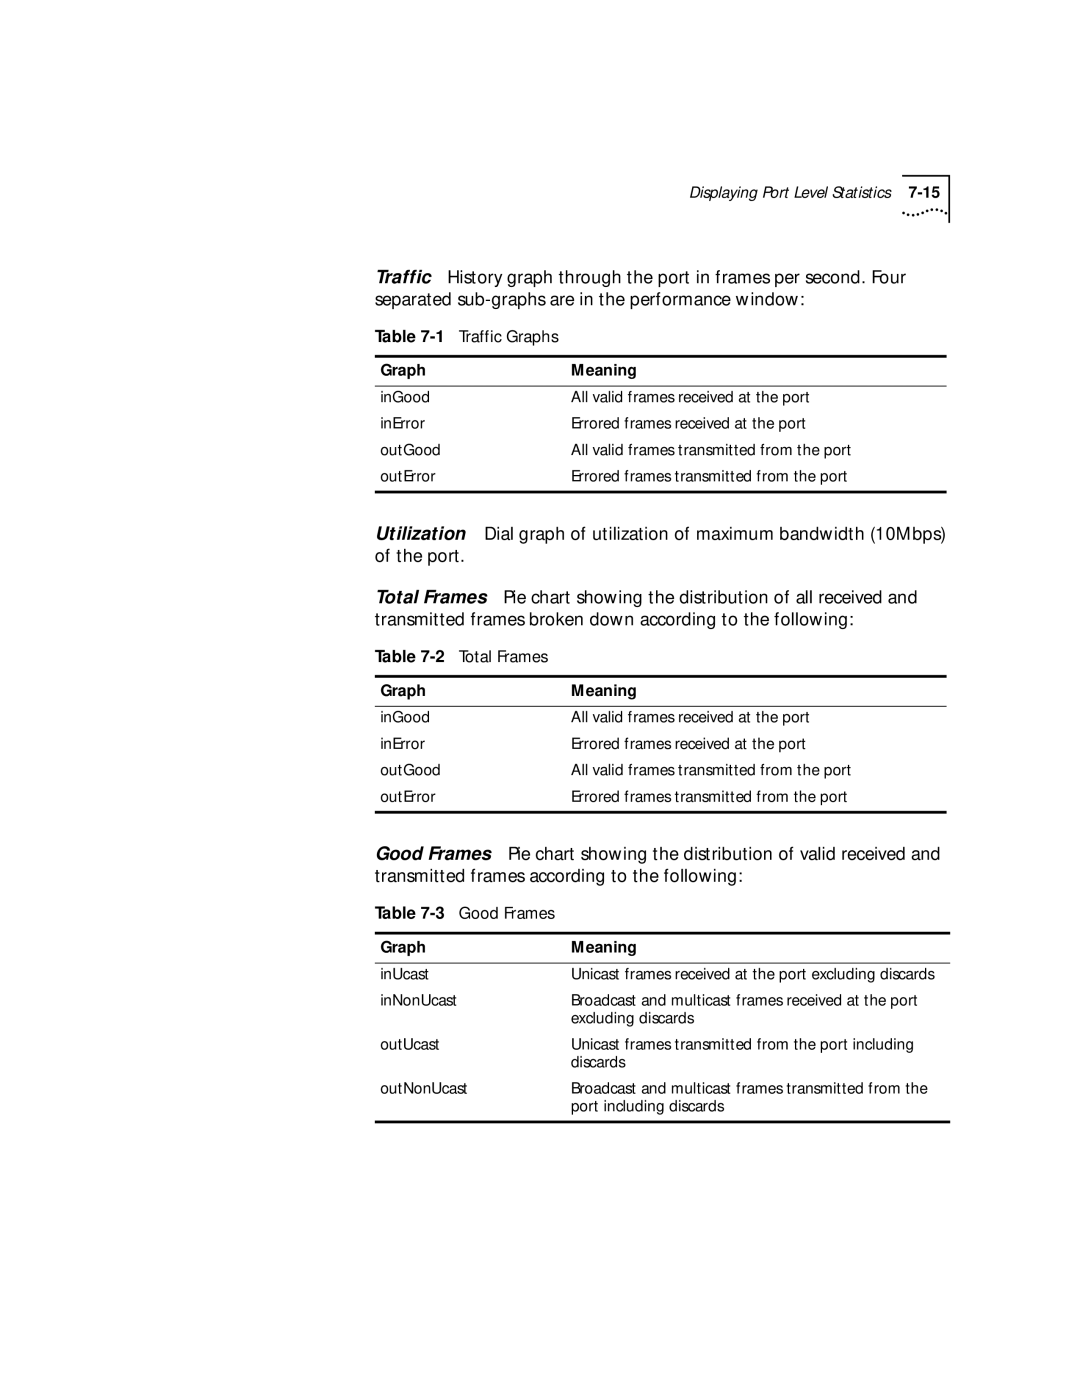
1Traffic Graphs
2Total Frames
3Good Frames
Lane Component
Information for load balancing when required
Statistics
Lane User
13LES Graph Assistant
18CHAPTER 7 Network Performance Measurement Tasks
14LEC Graph Assistant
Select the Graph Assistant option from the ATMvLAN menu
15Statistic of Lane User Group Window
Select the Graph Assistant from the ATMvLAN menu
16LANE User Statistics Graph Zoom Display
Switch Domain
To display the statistics from an ATM switch
Select the ATM switch icon
Table A-0Supported Devices
Supported Devices
Connectivity form Fast Ethernet to ATM. It
Icons Present at Problem Startup
System Problems
Window Not Problem Generated
Action
Set Operation Failed Problem
Slow System Startup Problem
Snmp set operation failed
Message Type Meaning Action
Table B-1System Messages
They are not defined on
System Messages B-5
Lecs Configuration Snmp SET error
System Messages B-7
PDP is not running Error
ATM and Vlan Management Basics
Role of Edge Devices
Virtual Channels
Figure C-1Virtual Path/Channels Connections
Two levels of virtual channels are supported at the UNI
SVC PVC
Table C-2Comparison of SVC and PVC
Integrated ATM/Ethernet Switching
Vlan Type 3Com Product
ATM-based VLANs
Lecs
Figure C-3LAN Emulation Components
Admin and Default VLANs
Tag-based VLANs
Non-ATM VLANs
Protocol-based
VLANS
Protocol-based VLANs
Table C-1 Protocol Suite Protocol Types
14APPENDIX C ATM and Vlan Management Basics
Glossary
Glossary
Network
Platform NMP Network
SmartAgent
Glossary
Index
LES C NNI C
JDK 1
MTU
ONcore Switch Module 2 -1, 2 -3, 2 -8, 2 -9 Oper Status 4
Topology Tool 1 10, 1 20, 1 23, 3
VPI C 3, C