3Com 4.2.2 manual Select the Graph Assistant from the ATMvLAN menu

Models: 4.2.2

1 243
Download 243 pages 20.41 Kb
Page 206
Image 206

7-20CHAPTER 7: NETWORK PERFORMANCE MEASUREMENT TASKS

LANE User The LANE User statistics parameters graph see Figure 7-15, displays a group of statistics per LEC. The display shows the in traffic and out traffic on the LEC and its segments. These graphs use the Transcend common grapher tool. You may select to display all or part of the LEC groups in the LANE User statistic.

To display performance statistics for an LEC:

1Select the LANE User icon from the management maps or a LANE User device component in the Component View of the Topology Browser.

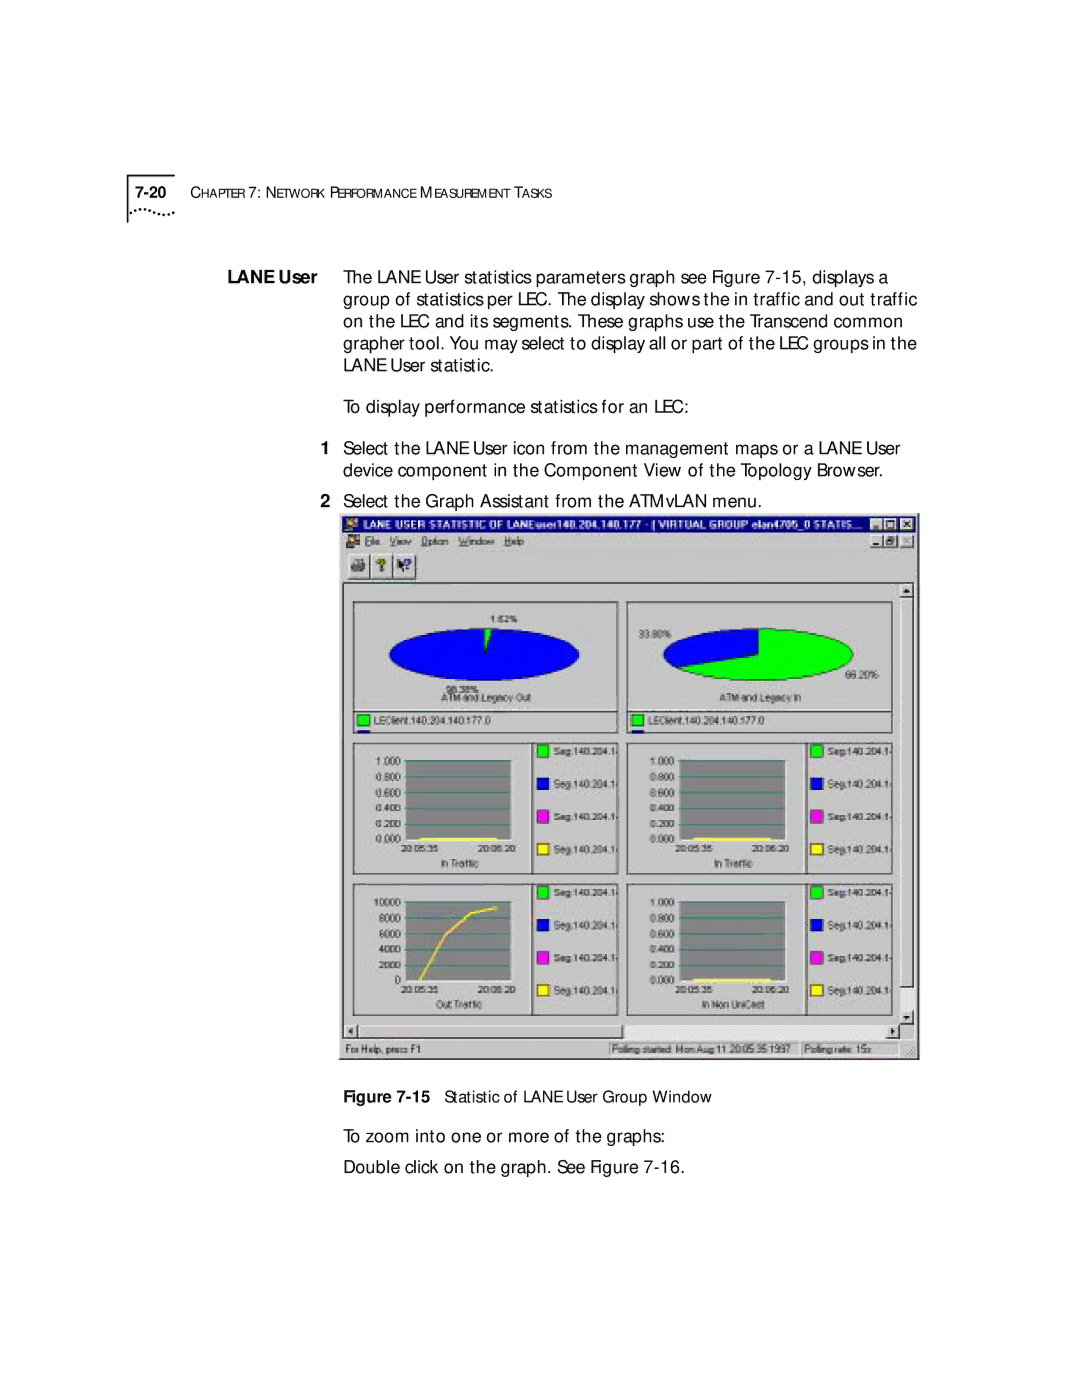
2Select the Graph Assistant from the ATMvLAN menu.

Figure 7-15Statistic of LANE User Group Window

To zoom into one or more of the graphs:

Double click on the graph. See Figure 7-16.

Page 206
Image 206
3Com 4.2.2 manual Select the Graph Assistant from the ATMvLAN menu, 15Statistic of Lane User Group Window