MODEL 3081 pH/ORP | SECTION 14.0 |
| ORP MEASUREMENTS |
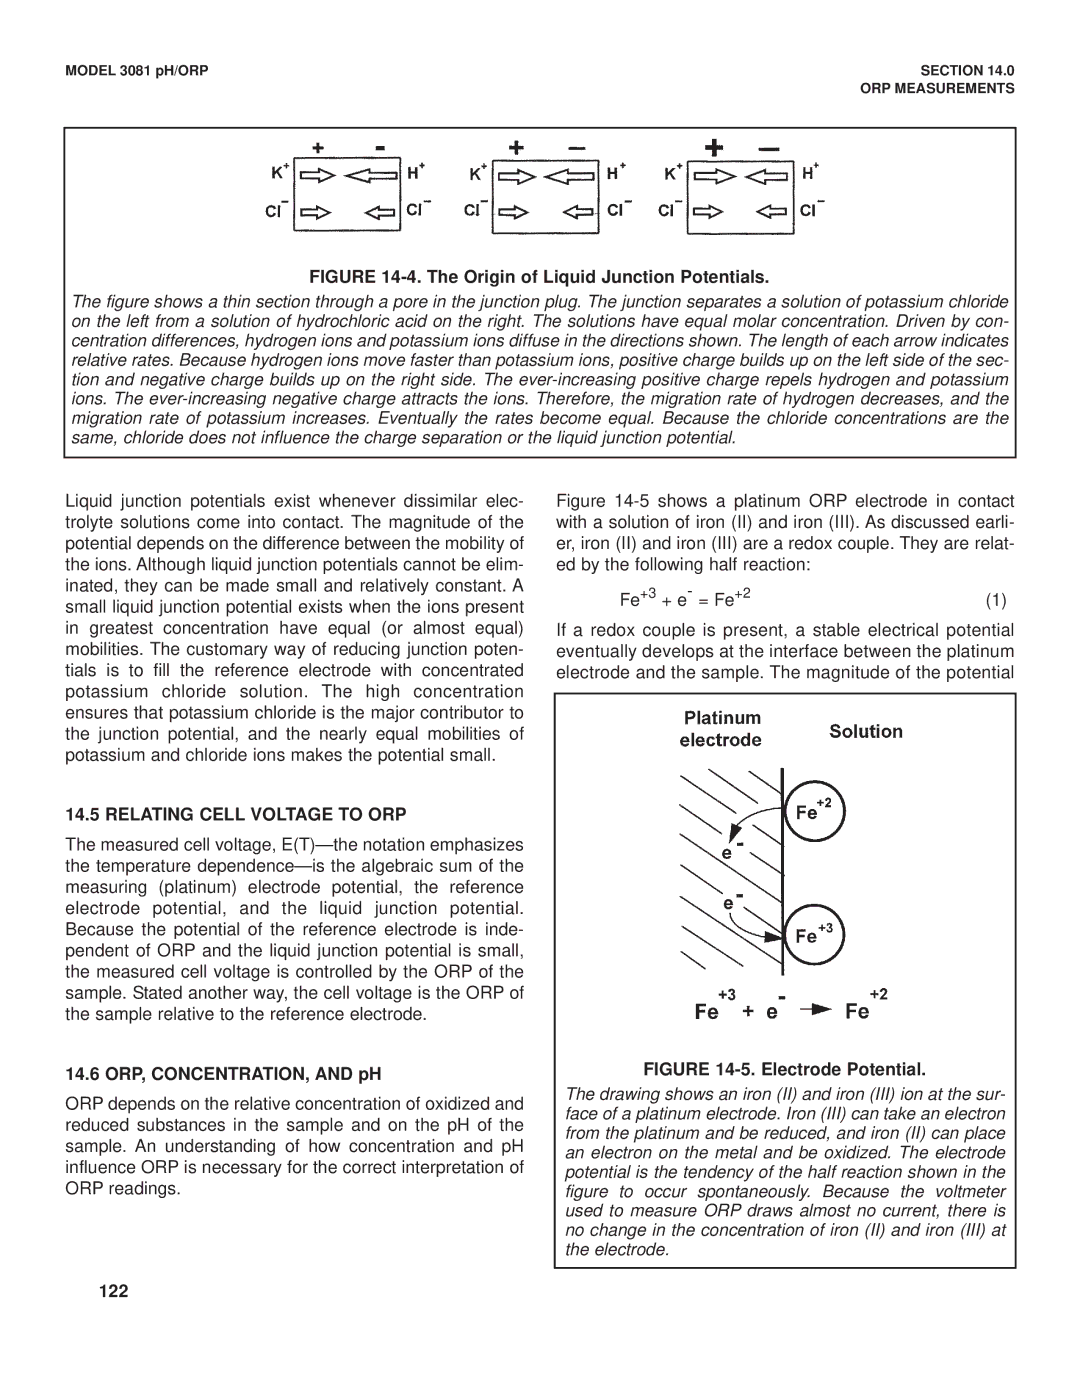
FIGURE 14-4. The Origin of Liquid Junction Potentials.
The figure shows a thin section through a pore in the junction plug. The junction separates a solution of potassium chloride on the left from a solution of hydrochloric acid on the right. The solutions have equal molar concentration. Driven by con- centration differences, hydrogen ions and potassium ions diffuse in the directions shown. The length of each arrow indicates relative rates. Because hydrogen ions move faster than potassium ions, positive charge builds up on the left side of the sec- tion and negative charge builds up on the right side. The ever-increasing positive charge repels hydrogen and potassium ions. The ever-increasing negative charge attracts the ions. Therefore, the migration rate of hydrogen decreases, and the migration rate of potassium increases. Eventually the rates become equal. Because the chloride concentrations are the same, chloride does not influence the charge separation or the liquid junction potential.
Liquid junction potentials exist whenever dissimilar elec- trolyte solutions come into contact. The magnitude of the potential depends on the difference between the mobility of the ions. Although liquid junction potentials cannot be elim- inated, they can be made small and relatively constant. A small liquid junction potential exists when the ions present in greatest concentration have equal (or almost equal) mobilities. The customary way of reducing junction poten- tials is to fill the reference electrode with concentrated potassium chloride solution. The high concentration ensures that potassium chloride is the major contributor to the junction potential, and the nearly equal mobilities of potassium and chloride ions makes the potential small.
14.5 RELATING CELL VOLTAGE TO ORP
The measured cell voltage,
14.6 ORP, CONCENTRATION, AND pH
ORP depends on the relative concentration of oxidized and reduced substances in the sample and on the pH of the sample. An understanding of how concentration and pH influence ORP is necessary for the correct interpretation of ORP readings.
Figure 14-5 shows a platinum ORP electrode in contact with a solution of iron (II) and iron (III). As discussed earli- er, iron (II) and iron (III) are a redox couple. They are relat- ed by the following half reaction:
Fe+3 + e- = Fe+2 | (1) |
If a redox couple is present, a stable electrical potential eventually develops at the interface between the platinum electrode and the sample. The magnitude of the potential
FIGURE 14-5. Electrode Potential.
The drawing shows an iron (II) and iron (III) ion at the sur- face of a platinum electrode. Iron (III) can take an electron from the platinum and be reduced, and iron (II) can place an electron on the metal and be oxidized. The electrode potential is the tendency of the half reaction shown in the figure to occur spontaneously. Because the voltmeter used to measure ORP draws almost no current, there is no change in the concentration of iron (II) and iron (III) at the electrode.
