Chapter 9. Logging
Packet Load
Interface
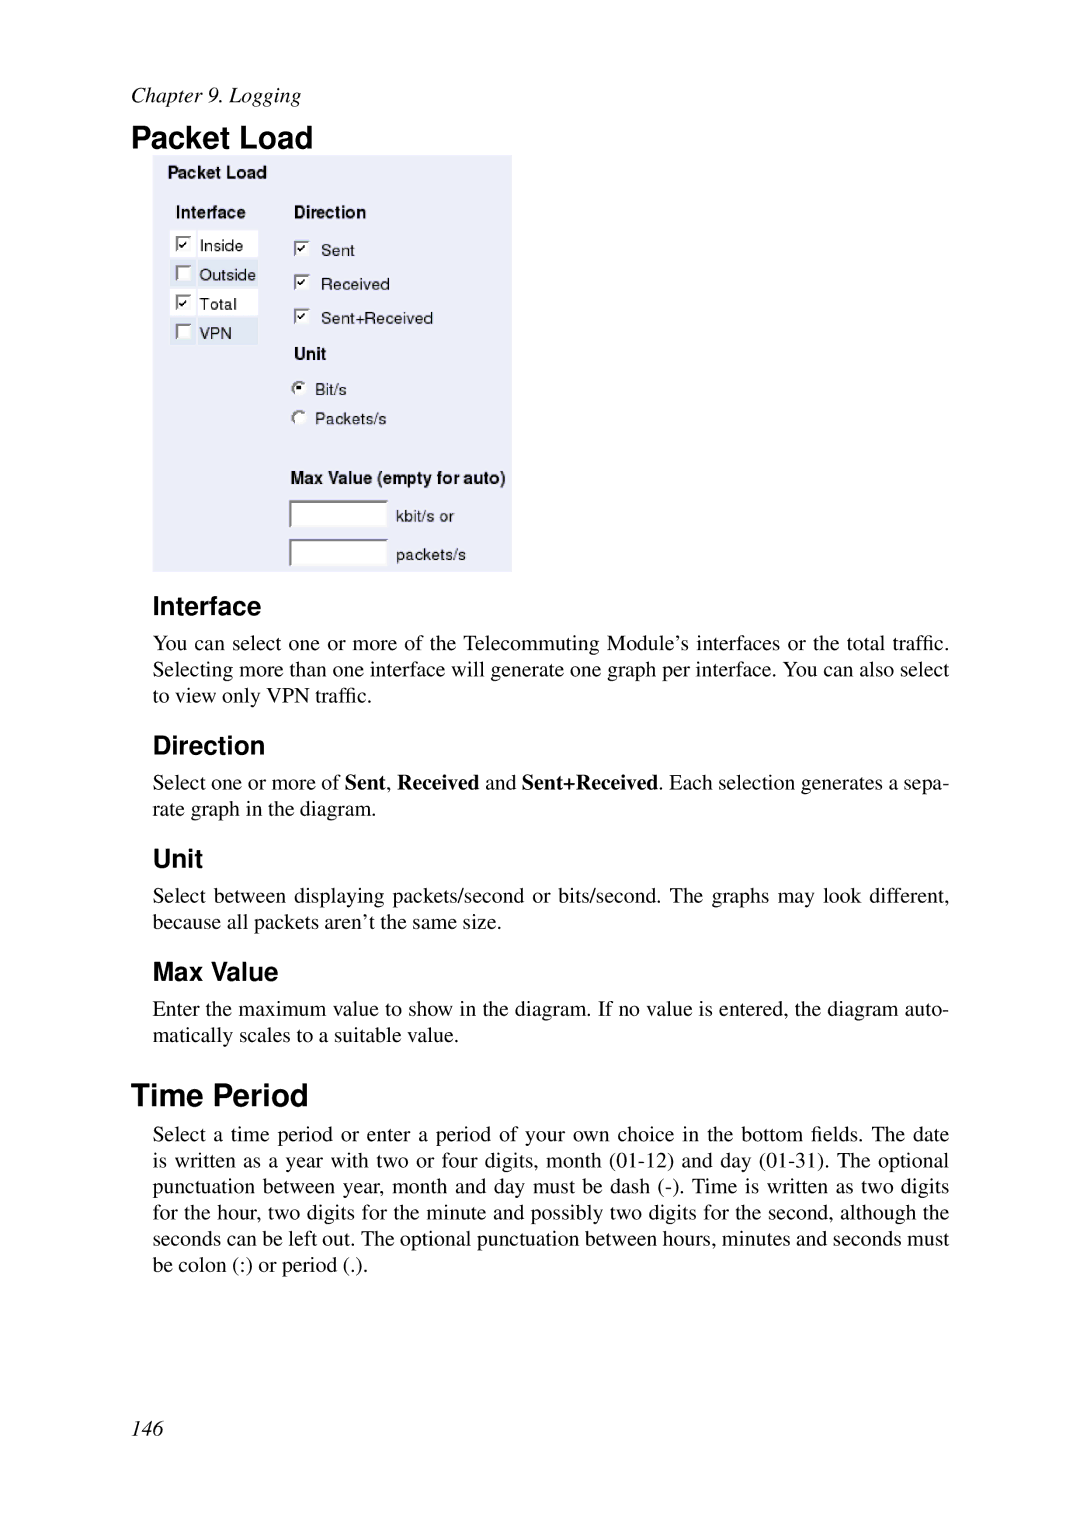
You can select one or more of the Telecommuting Module’s interfaces or the total traffic. Selecting more than one interface will generate one graph per interface. You can also select to view only VPN traffic.
Direction
Select one or more of Sent, Received and Sent+Received. Each selection generates a sepa- rate graph in the diagram.
Unit
Select between displaying packets/second or bits/second. The graphs may look different, because all packets aren’t the same size.
Max Value
Enter the maximum value to show in the diagram. If no value is entered, the diagram auto- matically scales to a suitable value.
Time Period
Select a time period or enter a period of your own choice in the bottom fields. The date is written as a year with two or four digits, month
146