There may be some daily variation in the Running Indexes. Many factors influence Running Index. The value you receive on a given day is affected by changes in running circumstances, for example different surface, wind or temperature, in addition to other factors.
LONG-TERM ANALYSIS
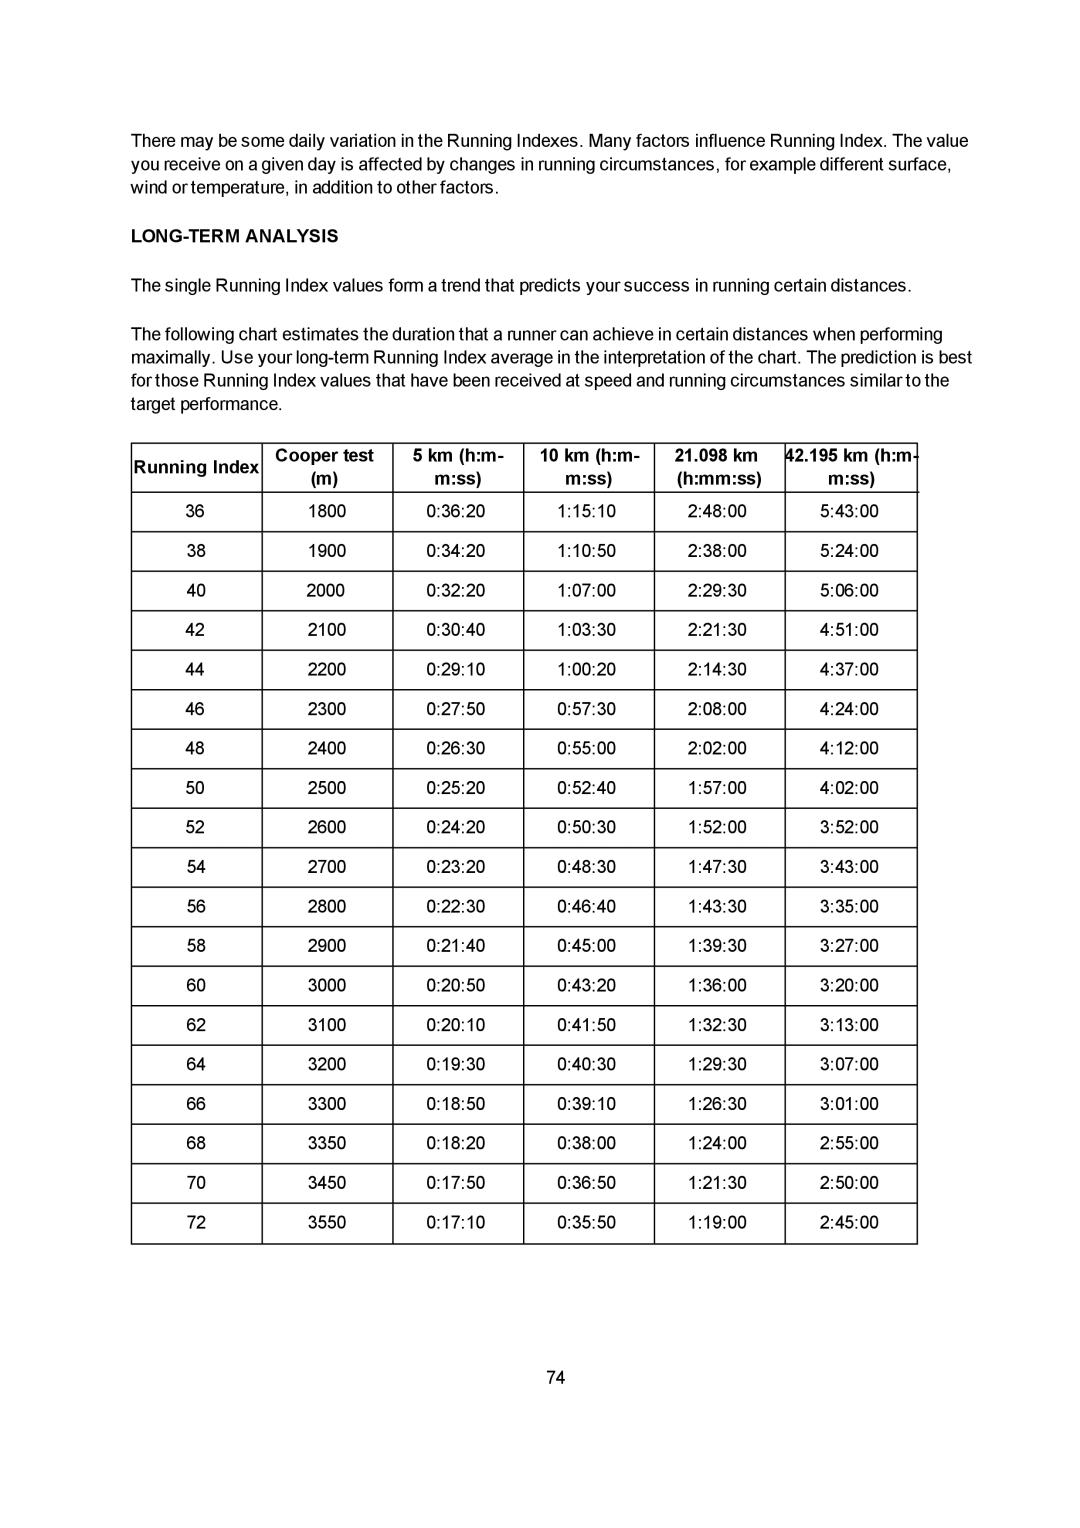
The single Running Index values form a trend that predicts your success in running certain distances.
The following chart estimates the duration that a runner can achieve in certain distances when performing maximally. Use your
Running Index | Cooper test | 5 km (h:m- | 10 km (h:m- | 21.098 km | 42.195 km (h:m- |
| (m) | m:ss) | m:ss) | (h:mm:ss) | m:ss) |
36 | 1800 | 0:36:20 | 1:15:10 | 2:48:00 | 5:43:00 |
|
|
|
|
|
|
38 | 1900 | 0:34:20 | 1:10:50 | 2:38:00 | 5:24:00 |
|
|
|
|
|
|
40 | 2000 | 0:32:20 | 1:07:00 | 2:29:30 | 5:06:00 |
|
|
|
|
|
|
42 | 2100 | 0:30:40 | 1:03:30 | 2:21:30 | 4:51:00 |
|
|
|
|
|
|
44 | 2200 | 0:29:10 | 1:00:20 | 2:14:30 | 4:37:00 |
|
|
|
|
|
|
46 | 2300 | 0:27:50 | 0:57:30 | 2:08:00 | 4:24:00 |
|
|
|
|
|
|
48 | 2400 | 0:26:30 | 0:55:00 | 2:02:00 | 4:12:00 |
|
|
|
|
|
|
50 | 2500 | 0:25:20 | 0:52:40 | 1:57:00 | 4:02:00 |
|
|
|
|
|
|
52 | 2600 | 0:24:20 | 0:50:30 | 1:52:00 | 3:52:00 |
|
|
|
|
|
|
54 | 2700 | 0:23:20 | 0:48:30 | 1:47:30 | 3:43:00 |
|
|
|
|
|
|
56 | 2800 | 0:22:30 | 0:46:40 | 1:43:30 | 3:35:00 |
|
|
|
|
|
|
58 | 2900 | 0:21:40 | 0:45:00 | 1:39:30 | 3:27:00 |
|
|
|
|
|
|
60 | 3000 | 0:20:50 | 0:43:20 | 1:36:00 | 3:20:00 |
|
|
|
|
|
|
62 | 3100 | 0:20:10 | 0:41:50 | 1:32:30 | 3:13:00 |
|
|
|
|
|
|
64 | 3200 | 0:19:30 | 0:40:30 | 1:29:30 | 3:07:00 |
|
|
|
|
|
|
66 | 3300 | 0:18:50 | 0:39:10 | 1:26:30 | 3:01:00 |
|
|
|
|
|
|
68 | 3350 | 0:18:20 | 0:38:00 | 1:24:00 | 2:55:00 |
|
|
|
|
|
|
70 | 3450 | 0:17:50 | 0:36:50 | 1:21:30 | 2:50:00 |
|
|
|
|
|
|
72 | 3550 | 0:17:10 | 0:35:50 | 1:19:00 | 2:45:00 |
|
|
|
|
|
|
74
