Global Settings
Using EthernetTV Reporter
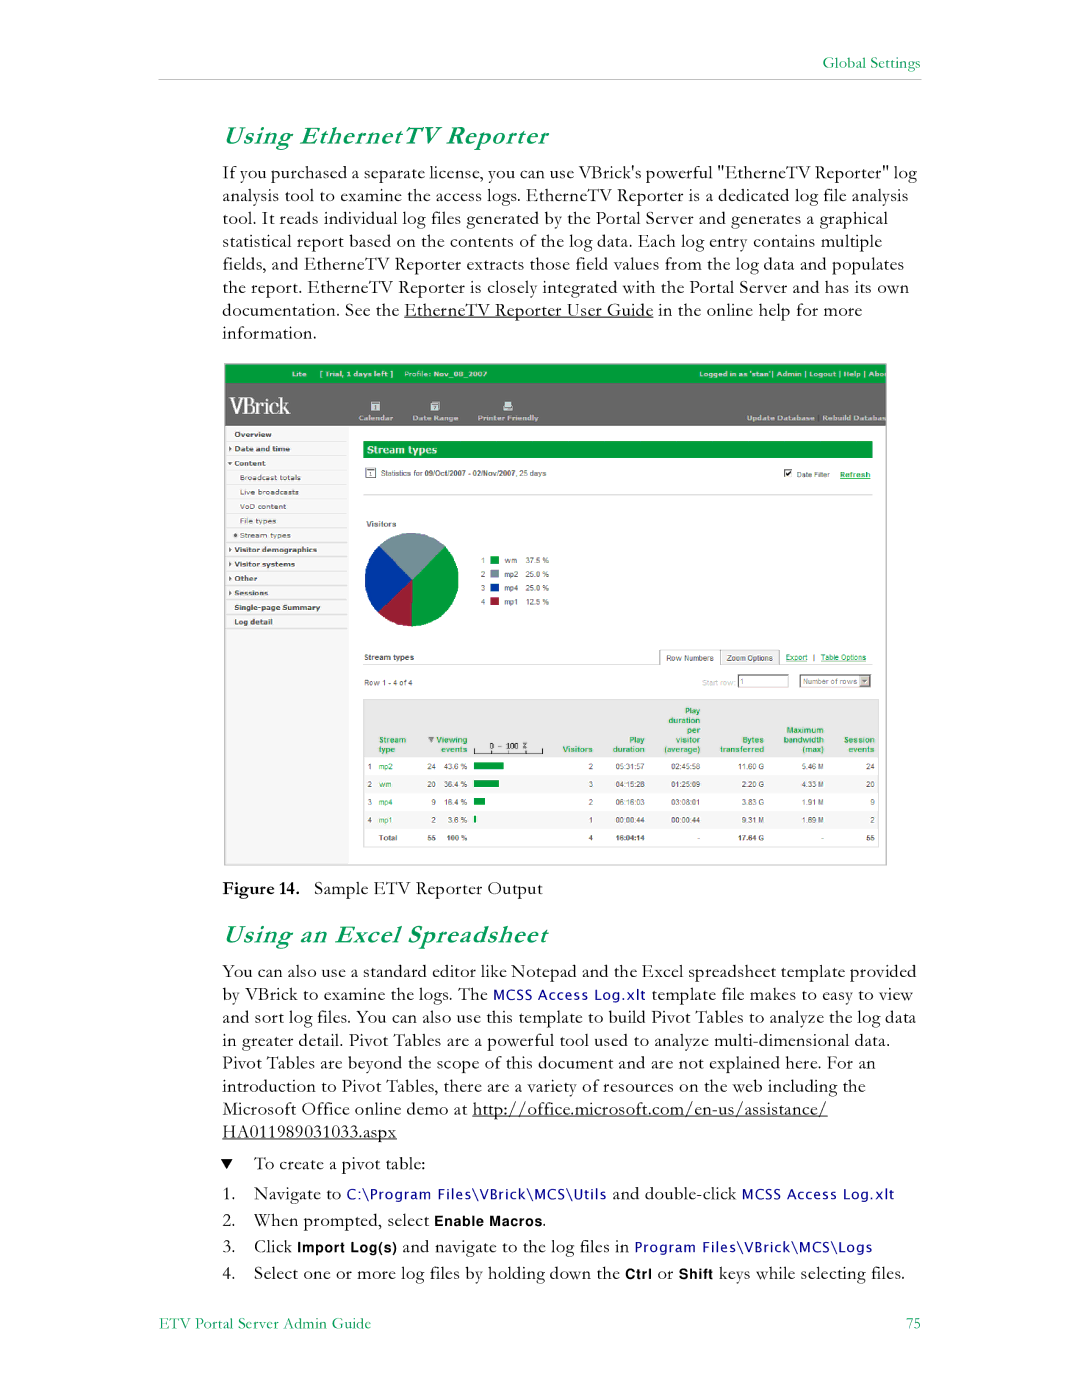
If you purchased a separate license, you can use VBrick's powerful "EtherneTV Reporter" log analysis tool to examine the access logs. EtherneTV Reporter is a dedicated log file analysis tool. It reads individual log files generated by the Portal Server and generates a graphical statistical report based on the contents of the log data. Each log entry contains multiple fields, and EtherneTV Reporter extracts those field values from the log data and populates the report. EtherneTV Reporter is closely integrated with the Portal Server and has its own documentation. See the EtherneTV Reporter User Guide in the online help for more information.
Figure 14. Sample ETV Reporter Output
Using an Excel Spreadsheet
You can also use a standard editor like Notepad and the Excel spreadsheet template provided by VBrick to examine the logs. The MCSS Access Log.xlt template file makes to easy to view and sort log files. You can also use this template to build Pivot Tables to analyze the log data in greater detail. Pivot Tables are a powerful tool used to analyze
Pivot Tables are beyond the scope of this document and are not explained here. For an introduction to Pivot Tables, there are a variety of resources on the web including the Microsoft Office online demo at
TTo create a pivot table:
1.Navigate to C:\Program Files\VBrick\MCS\Utils and
2.When prompted, select Enable Macros.
3.Click Import Log(s) and navigate to the log files in Program Files\VBrick\MCS\Logs
4.Select one or more log files by holding down the Ctrl or Shift keys while selecting files.
ETV Portal Server Admin Guide | 75 |