6-4 CHAPTER 6: MONITORING THE SWITCH 2000 TR
Current UtilizationThe percentage of bandwidth
usage for the port you are currently viewing. This
value indicates the general traffic level on the individ-
ual port. Ideally, this figure should be below 60%,
which indicates that the port is responsible for a rea-
sonable amount of traffic relative to the entire ring.
High utilization values suggest that you should adjust
the network topology by reducing load on that port
by segmentation.
Frames ForwardedA running average of the pro-
portion of the received frames that are forwarded.
This value is expressed as a percentage of all received
frames, based on a sampling interval of 20 seconds.
Broadcast Frame BandwidthA running average
of the broadcast frame bandwidth. This value is
expressed as a percentage of theoretical maximum
bandwidth availability, based on a sampling interval
of 20 seconds.
Error FramesThis field displays a running average
of the percentage of error frames with CRC errors
and is based on a sampling interval of 20 seconds.
Traffic StatisticsSelect this category to view the
Port Statistics (Traffic) screen. See the next section.
Port Statistics (Traffic)
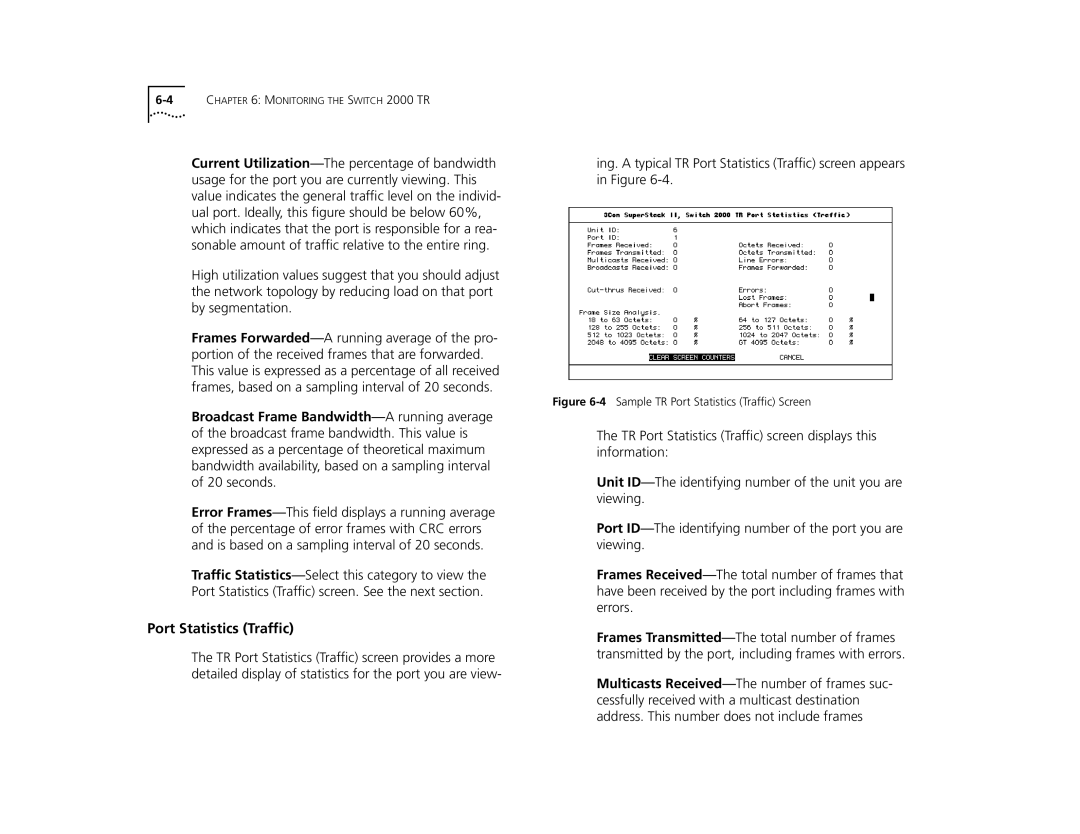
The TR Port Statistics (Traffic) screen provides a more
detailed display of statistics for the port you are view-
ing. A typical TR Port Statistics (Traffic) screen appears
in Figure 6-4.
Figure 6-4 Sample TR Port Statistics (Traffic) Screen
The TR Port Statistics (Traffic) screen displays this
information:
Unit IDThe identifying number of the unit you are
viewing.
Port IDThe identifying number of the port you are
viewing.
Frames ReceivedThe total number of frames that
have been received by the port including frames with
errors.
Frames TransmittedThe total number of frames
transmitted by the port, including frames with errors.
Multicasts ReceivedThe number of frames suc-
cessfully received with a multicast destination
address. This number does not include frames