About this Manual
HP Part No -90218 Supersedes
Fia Hewlett
Page
Certification
Warranty
Regulatory Information
Assistance
Safety Notes
Prevent electrical shock, do not remove covers
General Safety Considerations
Documentation Outline
How to Use This Guide
This guide uses the following conventions
Contents
Contents-2
Contents-3
Contents-4
Contents-5
Contents-6
Contents-7
Controller Section
Contents-9
Contents-10
Figures
Contents-12
Contents-13
Contents-14
Tables
Contents-15
PLL
Serial Number Label Example
Serial Numbers and Repair Information
General Information l-1
A21 Ocxo
Instrument Variations
Table l- 1. Instrument Variations
General Information
General Information l-3
HP 85629B Test and Adjustment Module
Table l-2. Service Kit Contents
Service Kit
Electrostatic Discharge
General Information l-5
Reducing Potential for ESD Damage
Static-Safe Accessories
Returning Instruments for Service
Static-Safe Accessories
Service Tag
Other Packaging
9211-6969 Outer Carton 9220-5073 Pads 9220-5072 Top Tray
General Information l-9
Recommended Test Equipment
Instrument Sources
Table l-4. Recommended Test Equipment
General Information l-l
Recommended Test Equipment
Instrument Critical Specifications Recommended Use
Instrument Accessories
PAV
PAM
Sales and Service Offices
US Field Operations
Hewlett-Packard Sales and Service Offices
Introduction
Adjustment Procedures
Test Equipment
Safety Considerations
Which Adjustments Should Be Performed?
Adjustable and Factory-Selected Components
Instrument Service Position
Adjustment Tools
8710-0033
A5 if
Related Adjustments
A10 Rythm
Adjustable Components
VCO Range
HV ADJ
FM Span
Smpl Match
Factory Selected Components
Adjustment Indicator
Using the TAM
YTO
TAM Adjustments
Required Test Equipment for TAM
Adjustment Procedures 2-l
Front End Cal adjustment
Related Performance Test
High Voltage Power Supply Adjustment
Assembly Adjusted
High Voltage Power Supply Adjustment
Equipment
Procedure
Display Adjustment
Display Adjustment
Cutoff Adjustment
Preliminary Adjustments
Deflection Adjustments
CRT Adjust Pattern Adjustment Procedures
Intensity Adjustments
A2 Display Adjustment Locations
Fast Zero Span Adjustments
Press SAVEI, Save State ,and State
If Bandpass Adjustment
If Bandpass Adjustment
TAM Connector Pin Locations
LC Bandpass Adjustments
Factory-Selected LC Filter Capacitors
Xtal Bandpass Adjustments
A5T202 Xtal CTR
Factory-Selected Xtal Filter Capacitors
Xtal Factory-Selected Capacitor Selection
A5T200 Xtal CTR
If Bandpass Adjustment 10. Capacitor Part Numbers
Related Performance Tests
If Amplitude Adjustments
If Amplitude Adjustment Locations
If Amplitude Adjustments
A5 Reference Attenuator Adjustment
A5 Adjustment Verification
DC Log Adjustment Setup Adjustment Procedures
DC Log Amplifier Adjustments
DC Log Amplifier Adjustments
A4 Limiter Phase Adjustment
Log Amplifier Adjustments
A4 Linear Fidelity Adjustment
Press -,a, if AlI on OFF OFF, AD3 Curr if State
A4 LOG Fidelity Adjustment
11. Sampler Adjustment Setup
Sampling Oscillator Adjustment
Sampler Match Adjustment
Sampling Oscillator Adjustment
Sampling Oscillator Adjustment
Sampling Oscillator Adjustment 1. Sampling Adjustments
YTO Adjustment
YTO Adjustment
07SAVE Save STATE, State RECALL, Recall STATE, State
YTO Main Coil Adjustments
14. YTO Adjustment Locations
YTO FM Coil Adjustments
15. First LO Distribution Amplifier Adjustment Setup
LO Distribution Amplifier Adjustment
18. TAM Connector Pin Locations
LO Distribution Amplifier Adjustment
DAC value for 4.60 GHz =
Automated Procedure Available
Frequency Response Adjustment
Frequency Response Adjustment
17. Frequency Response Adjustment Setup
MHz RF gain DAC value
Frequency‘Response Adjustment
Calibrator Amplitude Adjustment
Calibrator Amplitude Adjustment
MHz Reference Adjustment-OCXO Non-Option
19 MHz Reference Adjustment Setup and Adjustment Location
MHz Reference Adjustment-OCXO Non-Option
OFF
MHz Reference Adjustment-TCXO Option
MHz Reference Adjustment-TCXO Option
Procedure
Demodulator Adjustment
Demodulator Adjustment
SPAN, Zero Span
22. Demodulator Adjustment Locations Adjustment Procedures
23. External Mixer Bias Adjustment Setup
External Mixer Bias Adjustment Non-Option
External Mixer Amplitude Adjustment Non-Option
External Mixer Amplitude Adjustment Non-Option
Supplied with HP 8481D
EXT MXR REF CAL
25. Rythm Adjustment Setup
YIG-Tuned Filter/Mixer Rythm Adjustment
YIG-Tuned Filter/Mixer Rythm Adjustment
Save Presel PK
MHz PLL Adjustment
MHz PLL Adjustment
27 MHz PLL Adjustment Location
MHz PLL Adjustment
MHz Reference Adjustment
Frequency Response Adjustment Software 3-l
Frequency Response Adjustment Software
Controller Computer
Frequency Response Adjustment Software
Getting Started
Spectrum Analyzers
Test Equipment Warmup Spectrum Analyzer Warmup
Warmup Time
Required Test Equipment Summary
HP-IB Cables
Computer Controller Setup
Adjustment Setups
Equipment Connections
Loading the Program
Using Frequency Response Adjustment Software
Program Operation
System Mass Storage File Location
Power Sensors
Conditions Menu
Test Record Header Information
Storing and Loading the Conditions File
Setting HP-IB Addresses
Querying the Spectrum Analyzer Serial Number
Getting to the Adjust Menu
Exiting Frequency Response Adjustment
Verifying the HP-IB
Sensor Utilities Menu
Adding a Power Sensor Data File
Adjust Menu
Single Test
Calibrate Power Sensor
List Equipment
List Files
Frequency Response Adjustment Menu Softkeys
Single Test Cal Sensor List Equip Cond Menu
Assemblies Adjusted
APC 3.5 Cable 0 E’
Error Messages Beginning with Alphabetic Characters
Frequency Response Adjustment Error Messages
No HP-IB address listed for DUT
Power meter reads value dBm
File filename not found
Insufficient equip. to do test test number test name
Error Messages Beginning with Numeric Characters
Error Messages Beginning with Variables
Assembly Replacement
Assembly Replacement
Access to Internal Assemblies
Required Tools
Cable Color Code
Removal/Replacement
Procedure I. Spectrum Analyzer Cover
Procedure 2. Al Front Frame/Al8 CRT
Procedure 2. Al Front Frame/Al8 CRT
Removal
Procedure 2. Al Front Frame/Al8 CRT
Instrument
Discharging High Voltage on the CRT Assembly Replacement
A9, A18, and Line-Switch Assembly Mounting Screws
Front frame Mounting Screws
Installing the CRT and front frame Assemblies
Replacement
Placing the CRT into the Front Frame
Assembly Replacement 4-l
Procedure 2. Al Front Frame/Al8 CRT
Procedure 3. AlAl Keyboard/Front Panel Keys
Procedure 3. Al Al Keyboard/Front Panel Keys
Procedure 4. AlA RPG
Procedure 5. A2, A3, A4, and A5 Assemblies
Procedure 5. A2, A3, A4, and A5 Assemblies
Assembly Replacement 4
A2, A3, A4, and A5 Assembly Removal
4P3
Assembly Cables 2 Assembly Replacement
Coaxial Cable Clip
Procedure 5. A2, A3, A4, and AS Assemblies
10. HP-IB and AlAl Wl Cable Placement Assembly Replacement
Procedure 6. A6 Power Supply Assembly
Procedure 6. A6 Power Supply Assembly
Replacement
1. A6 Power Supply Connections Assembly Replacement
12. Power Supply Cover Assembly Replacement
Procedure 7. A6Al High Voltage Assembly
Procedure 7. A6Al High Voltage Assembly
13. Al6 Fast ADC and Al7 CRT Driver Mounting Screws
Procedure 7. A6Al High Voltage Assembly
Procedure 8. A7 through Al3 Assemblies
14. HP 6562E Assembly Locations
Procedure 6. A7 through Al3 Assemblies
A7 First LO Distribution Amplifier
A8 Low Band Mixer
Assembly Replacement 4-3
A8 Low Band Mixer
A9 Input Attenuator
A9 Input Attenuator
16. A10 Mounting Screws
A10 YIG-Tuned Filter/Mixer Rythm
All YTO
All YTO
Al3 Second Converter
Procedure 9. Al4 and A15 Assemblies
Procedure 9. Al4 and Al5 Assemblies
Procedure 9. Al4 and Al5 Assemblies
19. Al4 and Al5 Assembly Cables Assembly Replacement
20. Al6 and Al7 Mounting Screws Assembly Replacement
Procedure 10. Al6 Fast ADC and Al7 CRT Driver
21. Al6 Cable Routing Assembly Replacement
Procedure 10. Al6 Fast ADC and Al7 CRT Driver
Procedure 11. Bl Fan
Procedure 12. ET1 Battery
Procedure 12. BTI Battery
Procedure 13. Rear Frame/Rear Dress Panel
22. Main Deck Screws
Procedure 13. Rear Frame/Rear Dress Panel
W24, coax 5 W23, coax
23. A6 Power Supply Cover Assembly Replacement
Personnel and damage to the instrument
Procedure 14. W3 Line Switch Cable
24. W3 Dress and Connection to A6 Power Supply
Procedure 14. W3 Line Switch Cable
Screw Quantity
Standoff
26. W3 Cable Connector
Replacement Using Contact Removal Tool, HP part number
Replacement without Contact Removal Tool
27. Side Frame Mounting Screws
Procedure 15. Eerom A2U500
Procedure 15. Eerom A2U500
28. A21 Ocxo Mounting Screws Assembly Replacement
Procedure 16. A21 Ocxo
Procedure 16. A21 Ocxo
Direct Mail-Order System
Ordering Information
Replaceable Parts 5-l
Replaceable Parts
Parts List Format
Firmware-Dependent Part Numbers
Direct Phone-Order System
Reference Designations, Abbreviations and Multipliers
Reference Designations, Abbreviations, and Multipliers 2
Reference Designations, Abbreviations, and Multipliers 3
Reference Designations, Abbreviations, and Multipliers 4
Manufacturers Code List
Qty
Front Handle ASS’Y Mount Flange
Front Frame Assembly
SLIDE-CHAS 25-IN-LG 21.84-IN-TRVL
Interface Assembly
Cable Assembly Ribbon
Cable Assembly Probe POWER/LED
Controller Assembly
Not Assigned Line Filter Assembly
CRT Driver Assembly CRT Assembly
HP-IB Assembly
Battery 3.0 V 1.2 A-HR Lithium
If 1 Bottom
Cable ASSEMBLY, A7/A8 Drive
Power CABLE, Ribbon
Cable Assembly Line Switch
Cable ASSEMBLY, Speaker
Cable ASSEMBLY, Coax 6, 0 Span Video
Cable ASSEMBLY, A10 Rythm Drive
Cable ASSEMBLY, Coax 97, LO Sweep
Cable ASSEMBLY, Coax
Cable ASSEMBLY, SEMI-RIGID, RF Input
Cable ASSEMBLY, SEMI-RIGID, 1ST LO
Cable ASSEMBLY, SEMI-RIGID, 1ST Mixer
Cable ASSEMBLY, Coax 89, CAL OUT
Parts Identification, Assembly Mounting
Parts List, Cover Assembly
SPACER, CRT TUBE, CRT
Parts List, Main Chassis
Parts List, RF Section
Probe Power Jack
Parts List, Front Frame
00000
Keycap Line
SCREW-MACHINE Assembly M3 X 0.5 12MM-LG
Rubber Keypad Includes Keycaps
LED-LAMP LUM-INT=560UCD IF=SOMA-MAX
Line Filter Module
Parts List, Rear Frame
5062-7755 3 1 Battery Holder Includes Wires
Monofluoride
\ \
‘v’
FI c
P3$CES
‘\‘\
Major Assembly and Cable Locations
Major Assembly and Cable Locations
A21OCXO
FL3 not Assigned FL4
Cables
Hinged Assemblies
1W2 W52
I T E
Bottom View Al5 Unfolded Major Assembly and Cable Locations
WI8 Aiai
Al6 Fast ADC Option Major Assembly and Cable Locations
\\\
Rear View Major Assembly and Cable Locations 6-l
Block Diagrams
Assembly Level Text
General Troubleshooting 7-l
Pad
Assembly Test Points
General Troubleshooting
Ribbon Cables
@AMPLIFIER
Ribbon Cable Connections 1 General Troubleshooting
Ribbon Cable Connections 2 General Troubleshooting
Service Cal Data Softkey Menus
PKEq
Service Cal Data Menu
Troubleshooting to a Functional Section
CRT
Location of Assembly Troubleshooting Text
Sloda
Rythm
Loading the software
TAM Test and Adjustment Module
Data files and system mass storage files
HP-IB addresses
Executing a test
TAM Requirements
Erroneous Results
Test Connectors
Revision Connectors
Inconsistent Results
ADC/lnterface Check
Automatic Fault Isolation
Display/Power Supply
Controller Check
LO Control Check
Manual Probe Troubleshooting
RF Low Band Check
Calibration Oscillator Troubleshooting Mode
RF Path Fault Isolation
Viewing Multiple Messages
Error Messages
Error Message Elimination
System Analyzer Programming Errors 100 to
System
ADC Errors 200 to
Roller PLL Errors 302 to
YTO Loop Errors 300 to
LO and RF Hardware/Firmware Failures 300 to
General Troubleshooting
General Troubleshooting
YTO Loop Errors 317 to
Roller Oscillator Errors 321 to
OFF Unlk Freq ACC
YTO Loop Error
Fractional N PLL
MHz Reference Loop
YTO Leveling Loop
Sampling Oscillator
Span Accuracy Calibration Errors 356 to
YTO Loop Settling Errors 351 to
Automatic if Errors 400 to
RBW
RBW 3K
LIN Ampl LOG Ampl
General Troubleshooting 7-3
General Troubleshooting
Ampl 1M
General Troubleshooting
General Troubleshooting
300 MHz
Digital and Checksum Errors 700 to
System Errors 600 to
Eerom Checksum Errors 700 to
ROM U306 ROM U307 ROM U308 ROM U309 ROM U310 ROM U311
Program ROM Checksum Errors 705 to
Microprocessor Error 7
Battery Problem
Model Number Error
RAM Check Errors 711 to
Fast ADC Error
System Errors 750 to
Option Module Errors 800 to
TG Unlvl
User-Generated Errors 900 to
Functional Sections General Troubleshooting
Block Diagram Description
A7 Sloda
RF Section
Al3 Second Converter
A10 YIG-Tuned Filter/Mixer
Second if Amplifier part of A15
Flatness Compensation Amplifiers part of AM
Third Converter part of A15
YTO PLL A7, All, part of A14, part of A15
Synthesizer Section
Sweeping the First LO
Reference PLL part of A15
Offset Lock Loop part of A15
Phase Lock Loops Fractional N PLL part of A14
If Section
A4 Log Amplifier/Cal Oscillator Assembly
ADC/lnterface Section
A5 if Assembly
Log Expand/Video Functions
Triggering
Controller Section
Firmware
Al7 CRT Display Driver
Display/Power Supply Section
A6 Power Supply
Display ASM
Page
Page
Page
Page
ADC/lnterface Section
ADC/lnterface Section
W2 Control Cable Connections
ADC/lntetface Section
GND RF Gain LO3 ERR LVFC-ENABLE FC ERR YTO ERR
GND Scan Ramp Video Trigger DAC2
A3 Test Connectors
Troubleshooting Using the TAM
ADC ASM ADC MUX
Automatic Fault Isolation References
TAM Tests versus A3 Test Connectors
Keyboard Interface
Keyboard/RPG Problems
Keyboard Matrix
RPG Interface
Free RUN Video Line External
Triggering or Video Gating Problems
Counter Frequencies
Trigger MUX Truth Table
10 ADC/lnterface Section
Level
Yiiqx5q
12 ADC/lntertace Section
Preselector Peaking Control Real Time DAC
ADC/lntefface Section
Flatness Control RF Gain DACs
14 ADC/lnterface Section
A3 Assembly Video Circuits
Log Offset/Log Expand
16 ADC/lnterface Section
Video MUX
Video Filter
Latch Outputs
Video Filter Buffer Amplifier
18 ADC/lnterface Section
Positive/Negative Peak Detectors
Select Desectdr POS Peak mode
HMUX-SELO/l versus Detector Mode
Peak Detector Reset
20 ADC/lnterface Section
ADC MUX
Rosenfell Detector
22 ADC/lnterface Section
Logic Levels at A3U108
Track and Hold
Variable Gain Amplifier VGA
ADC Control Signals
A3 Assembly ADC Circuits
24 ADC/lnterface Section
ADC Start/Stop Control
26 ADC/lnterface Section
ADC ASM
Ramp Counter
Analog Bus Drivers
A3 Assembly Control Circuits
28 ADC/lnterface Section
Analog Bus Timing
30 ADC/lnterface Section
Interface Strobe Select
10. Demultiple er A3U410 Truth Table
1. Demultiple er A3U500 Truth Table
Video Input Scaling Amplifiers and Limiter
Al6 Assembly Fast ADC Circuits Option
32 ADC/lnterface Section
Bit Flash ADC
NEG
Peak/Pit Detection
Byte Static RAM
POS
34 ADC/lntertace Section
Al6 Assembly Fast ADC Control Circuits Option
CPU Interface and Control Registers
13. Control Word at Primary Address U3 and U4
Lloadaddr
Vtrig POL
Lsample
Ladcen
38 ADC/lnterface Section
Reference Clock
Hswp
Trigger
Clock and Sample Rate Generator
Bit 32 K Circular Address Counter
Bit Post-Trigger Counter
Video Trigger Comparator
Page
QEL--QWa5-w---w
If -l
If Section
If Section
A4 LOG AMP/CAL OSC
Troubleshooting A5 with the TAM
Troubleshooting the Log Amplifier with the TAM
TAM Tests versus Test Connectors
Ifdac
Fdac
Cal fist Troubleshooting Nude
Troubleshooting the Cal Oscillator with the TAM
Sweep Width Settings
Automatic if Adjustment
Parameters Adjusted
Requirements
If Gain Uncertainty Performance lest
Performance Test Failures
Scale Fidelity Performance lest
Resolution Bandwidths Performance Tests
Log Amplifier P/O A4 Assembly
Log Amplifier
If Gain Application Guidelines ATTEN=lO dB
Linear Amplifiers
Video Off set
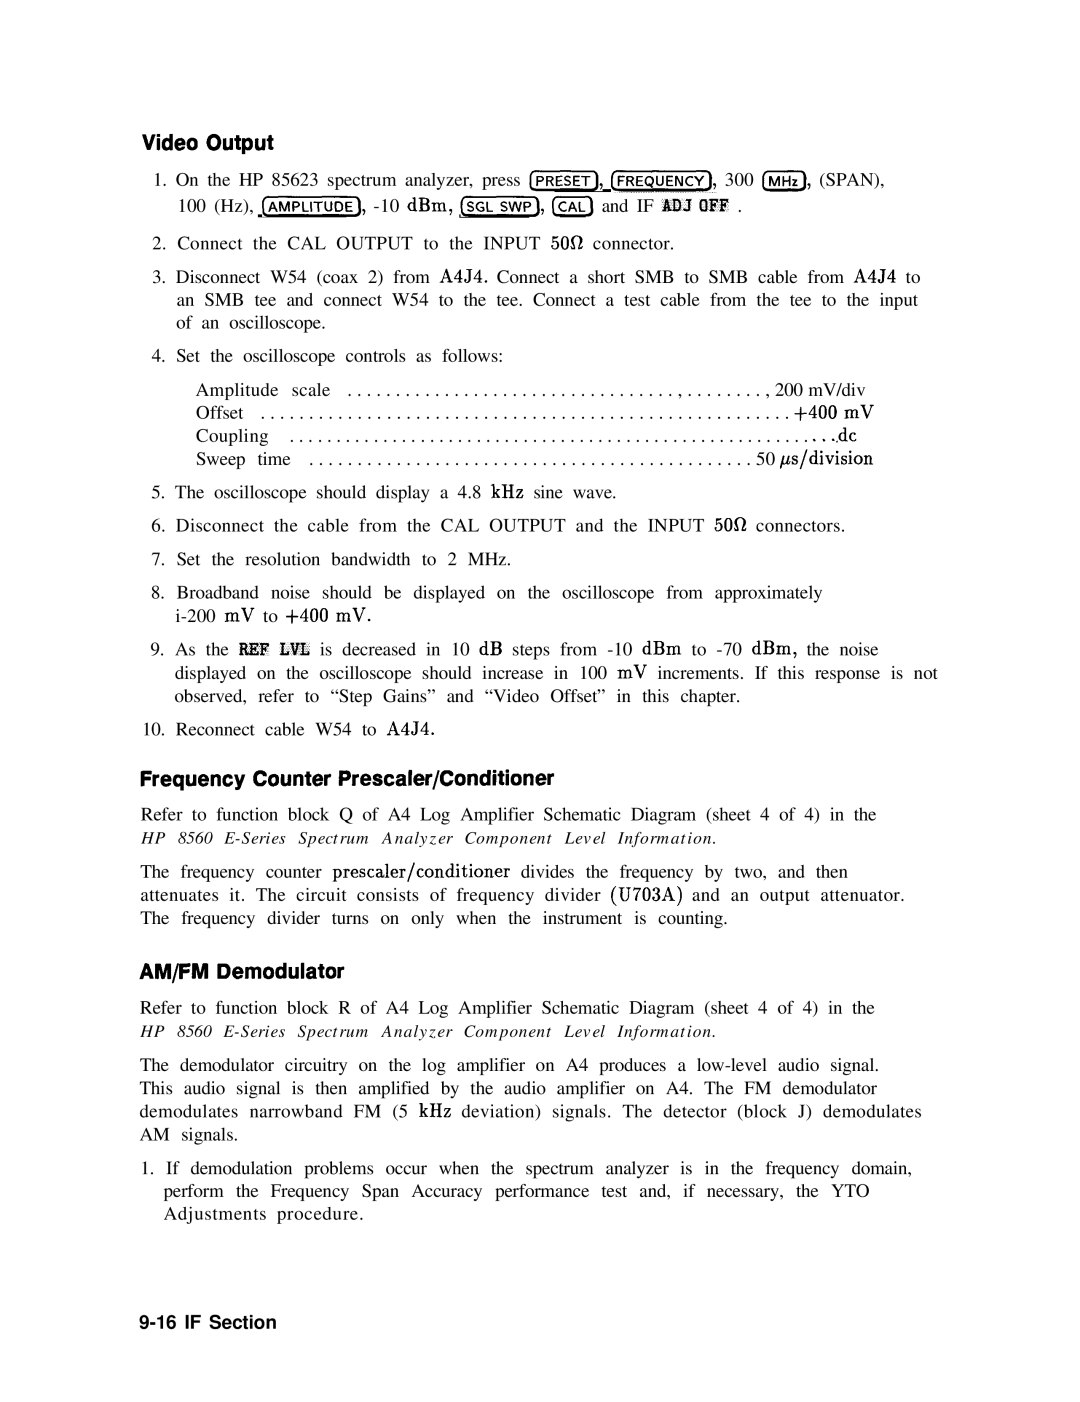
Frequency Counter Prescaler/Conditioner
Video Output
AM/FM Demodulator
MHz if Filters
KHz if Filters
MHz Vcxo
KHz and 10.7 MHz if Filters
LO Switch
Input Switch
Synchronous Detector
Log Off set/Gain Compensation
A5 if Assembly
KHz
If Signature
If Adjust Signature If Section
Detailed if Adjust Signature
LOG Ofysets
510 CjBm,-‘-ifTiN= dB 0 dBm II ill M P L E IIilI
Common if Signature Problems
L3klB
11. Region B Amplitude Variation
500
MHz Resolution Bandwidth Problems
KHz and 10 kHz Resolution Bandwidth Problems
KHz Resolution Bandwidth Problems
Step Gains
15. Faulty Crystal Symmetry
Cal Oscillator P/O A4 Assembly
Inadequate CAL OSC Amptd Range
Cal Oscillator Unlock at Beginning of if Adjust
Hz to 3 kHz Resolution Bandwidth Out of Specification
16. Output Waveform, 10 kHz Resolution Bandwidth If Section
17. Output Waveform, 3 kHz Resolution Bandwidth
19. Output Waveform, 300 Hz Resolution Bandwidth
Sweep Generator
Low-Pass Filter
AM/FM Demodulation, Audio Amplifier, and Speaker
If Section
Page
Page
Page
Controller -l
Controller Section
2 Controller Section
MSl, MS3 through MS6, MS8
Controller Section
A2 Test Connectors
Digital Signature Analysis DSA
Display Problems
Line Generators
Line Generator Output Waveforms
Blanking
Blanking Waveforms 6 Controller Section
Expanded Blanking Waveforms
Display Jumbled or Trace Off Screen
IO-8 Controller Section
Switch Driver Waveform Lchar
Distorted X/Y Line Generator Waveforms
Bad Characters or Graticule
Intensity
Lo-10 Controller Section
Delta X Waveform
Long Lines Dimmer Than Short Lines
Lo-12 Controller Section
Analog Zero-Span Problems Non-Option
Controller Section lo
Frequency-Count Marker Problems
Gate Times
Frequency Counter
Lo-14 Controller Section
Controller Section lo-15
State- and Trace-Storage Problems
Lo-16 Controller Section
Keyboard Problems
Page
Synthesizer l-1
Synthesizer Section
Synthesizer Section
A21 Ocxo
TAM Connector Pin Locations L. Measured Signal Line Location
Al4 and Al5 Test Connectors
4 Synthesizer Section
Synthesizer l-5
YTF
6 Synthesizer Section
DAC MS7
FAV
MS8 MS2 MS5 MS6 MS7
OFL
AGC
MS1 MS2 MS3 MS4 MS6 MS8 MS5,MS7,MS8
YTO PLL
Troubleshooting Test Setup
Confirming a Faulty Synthesizer Section
8 Synthesizer Section
Synthesizer l-9
Center Frequency Tuning Values
Check A3 ADC MUX Function Block steps
Check A14J301 10 MHz reference input steps
Check First LO steps
Check Al4 frequency control assembly steps
Synthesizer -l
YTO Loop Test Setup Check Al5 RF assembly steps
12 Synthesizer Section
4. Sampler and Sampling Oscillator Test Setup
Synthesizer
General PLL Troubleshooting
PLL Locked at Wrong Frequency
Sampling Oscillator Test Frequencies
PLL Locked at Wrong Frequency Synthesizer Section
REF- \ Y
Synthesizer l-15
Unlocked PLL
Check 100 MHz VCXO, tripler, and doubler steps
Troubleshooting
Unlocked Reference PLL
Operation
Check phase/frequency detector steps
Check 10 MHz reference to phase/frequency detector steps
Check the 100 MHz lock loop integrator steps
Check level at amplifier input steps
Third LO Driver Amplifier
20 Synthesizer Section
Unlocked Offset Lock Loop Sampling Oscillator
Check loop references steps 1
Check levels into mixer steps
Sampling Oscillator PLL Divide Numbers
Check path to phase/frequency detector steps
Unlocked YTO PLL
7. Amplifier Polarities
7. Troubleshooting an Unlocked YTO PLL Synthesizer l-25
Troubleshooting an Unlocked YTO PLL
26 Synthesizer Section
Check First LO pretune frequency and amplitude steps
Check FM loop sense steps
Check the fractional N oscillator steps
Check sampler drive output of A7 Sloda steps
Check sampler if steps
Synthesizer Section
Main Coil Coarse and Fine DACs Voltages
Voltages in FM Coil and Main Loop Drivers
Check main coil coarse and fine DACs steps
Check main coil tune DAC steps
30 Synthesizer Section
Confirming an Unlocked Condition
Unlocked Fractional N PLL
10. Postscaler Divide Numbers
Fractional N PLL
32 Synthesizer Section
Vco
1 1. Unlocked Fractional N Troubleshooting Areas
VCO
0AT VOLTAGE-CONTROLLED Oscillator
Synthesizer l-35
12. Divider and Integrator Troubleshooting
14. Harmonic Mixing Number versus Center Frequency
Frequency Span Accuracy Problems
13. Sweep Signal Destination versus Span
Determining the First LO Span
Synthesizer l-37
Confirming Span Problems
38 Synthesizer Section
YTO Main Coil Span Problems LO Spans 20 MHz
YTO FM Coil Span Problems LO Spans 2.01 MHz to 20 MHz
15. Settings of Sweep Switches
Synthesizer l-39
Fractional N Span Problems LO Spans 52 MHz
40 Synthesizer Section
First LO Span Problems All Spans
Check span attenuator steps
Check current source steps
16. Settings for Switches and Comparators
First LO Span Problems Multiband Sweeps
HP 6562E Sweep and Scan Ramps Synthesizer Section
Phase Noise in Locked versus Unlocked Spans
Phase Noise Problems
Reference versus Reference PLL Phase Noise
Fractional N PLL Phase Noise
Fractional N versus Offset PLL or YTO PLL Phase Noise
Sampler and Sampler if
Sweep Generator Circuit
Set a microwave source to the following settings
10. Simplified Synthesizer Section
JP/O a l
Al5 RF
50 Synthesizer Section
A21 Ocxo
Page
Page
RF Section
RF Section
Al4 and Al5 Test Connectors RF Section
Automatic Fault Isolation References
PIN
Low Band Problems
Low and High Band Problems
High Band Problems
A7 LO Distribution Amplifier
‘0 0 0 0 0 0
A8 Low Band Mixer
A9 Input Attenuator
Low
RF Section
Loda Drive
Al4 Frequency Control Assembly
RF -l
A7 First LO Distribution Amplifier Drive
Control Latch for Band-Switch Driver
YTF Driver Circuit
HP 8582E Rear-Panel LO SWP Output
FE RUI
Pbbzl Offset
Sweep + Tune Multiplier Values
Confirming a Faulty Third Converter
Al5 RF Assembly
Confirming Third Converter Output
Third Converter
Control Latches
Flatness Compensation Control
SIG ID Oscillator Option
Q604 on
MHz Reference
MHz Reference at A15J302 RF Section
MHz TTL Reference at U304 Pin RF Section
RF Section Mnemonic Table
Page
Isplay/Power Supply Section
@I w3
GND
Wl Power-Cable Connections
PWR UP
Pms Pins 41’ +28
Al7 Test Connector TAM Tests versus Test Connectors
Blank Display Using the TAM
Blank Display
Probe Power Socket
Blanking Signal
Display Distortion
Focus Problems
Intensity Problems
Display/Power Supply -l
Dead Power Supply
A6 Power Supply Assembly Troubleshooting
Check the Supply Voltages
Buck Regulator
Kick-start/Bias
Supply Restarting Every 1.5 Seconds Kick Start
Line Fuse Blowing
Buck Regulator Control Loop
Low Voltage Supplies
High Voltage Supplies
CRT Supply Dropping Out
DC-DC Converter Control
Buck Regulator Control
Power Up
Page
Page
Component-Level Information Packets A-l
Component-Level Information Packets
Component-Level Information Packets
Table A-l. HP 8562 Spectrum Analyzer Documented Assemblies
Component-Level Information Packets A-3
Table A-l. HP 8582 Spectrum Analyzer Documented Assemblies
Page
Index-l
Ocxo
AFI
Index-2
Fadc
Index-3
Index-4
Loda
Index-5
Index-6
Index-7
Index-6