AT-GS950/16PS Switch Web Interface User’s Guide
Traffic Comparison Statistics
The Traffic Comparison statistics chart allows you to display a specified traffic statistic over all of the ports. You can select 12 statistic types and 12 colors for each port.
To display traffic comparison statistics, perform the following procedure:
1.Select the Statistics Chart folder. The Statistics Chart folder expands.
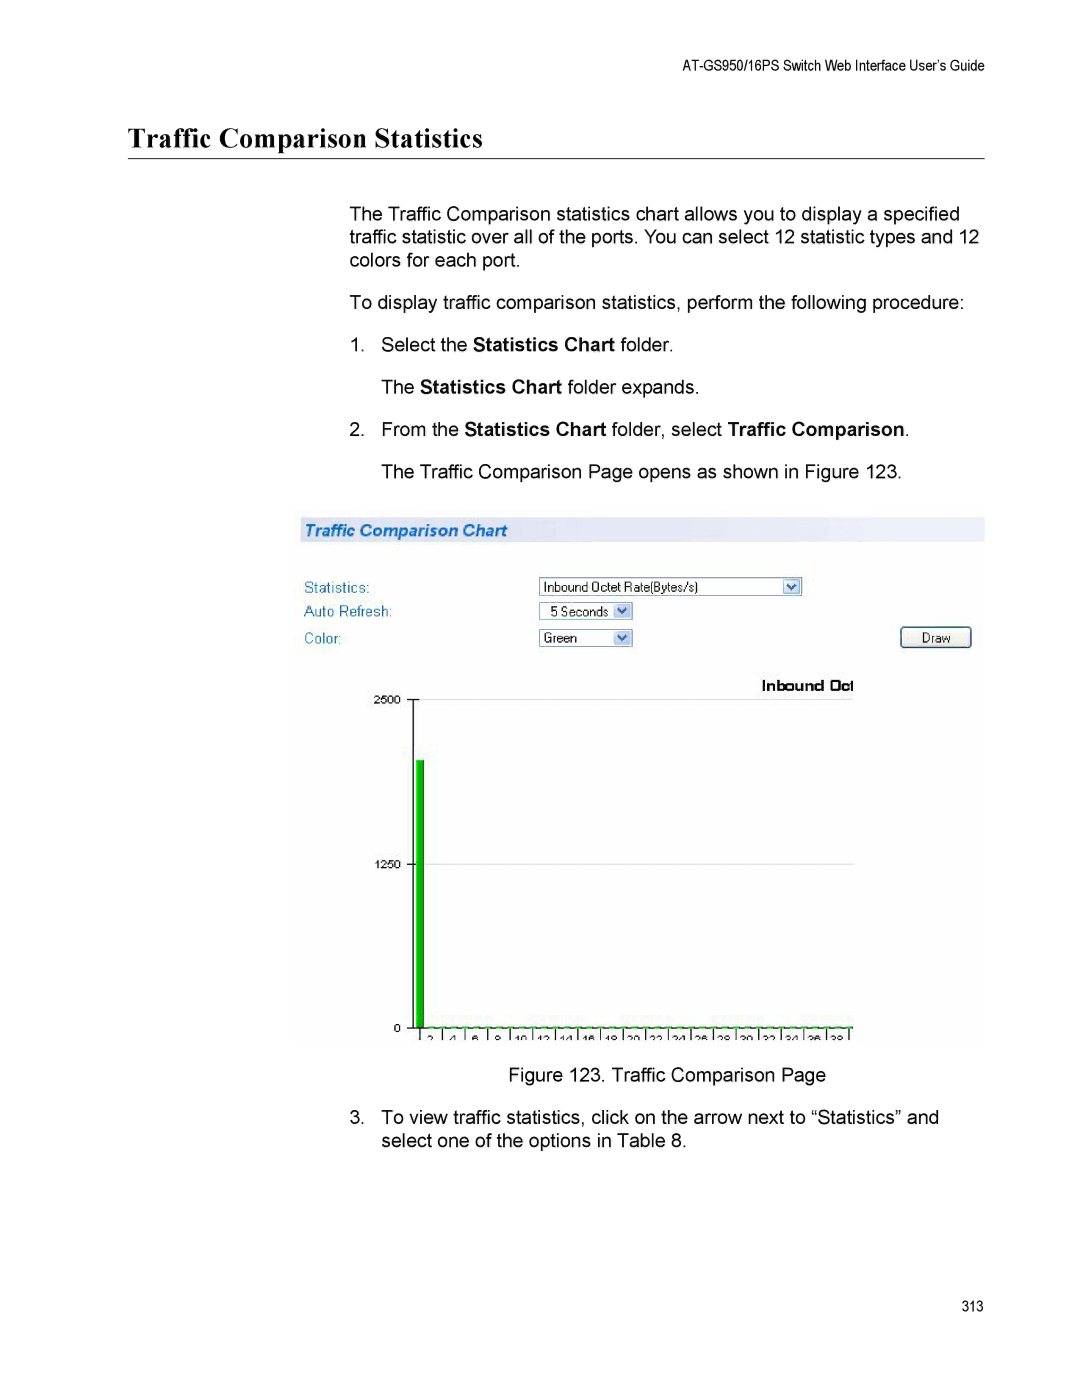
2.From the Statistics Chart folder, select Traffic Comparison. The Traffic Comparison Page opens as shown in Figure 123.
Figure 123. Traffic Comparison Page
3.To view traffic statistics, click on the arrow next to “Statistics” and select one of the options in Table 8.
313
