Chapter 2: Monitoring the SG Appliance
Health Monitoring Example
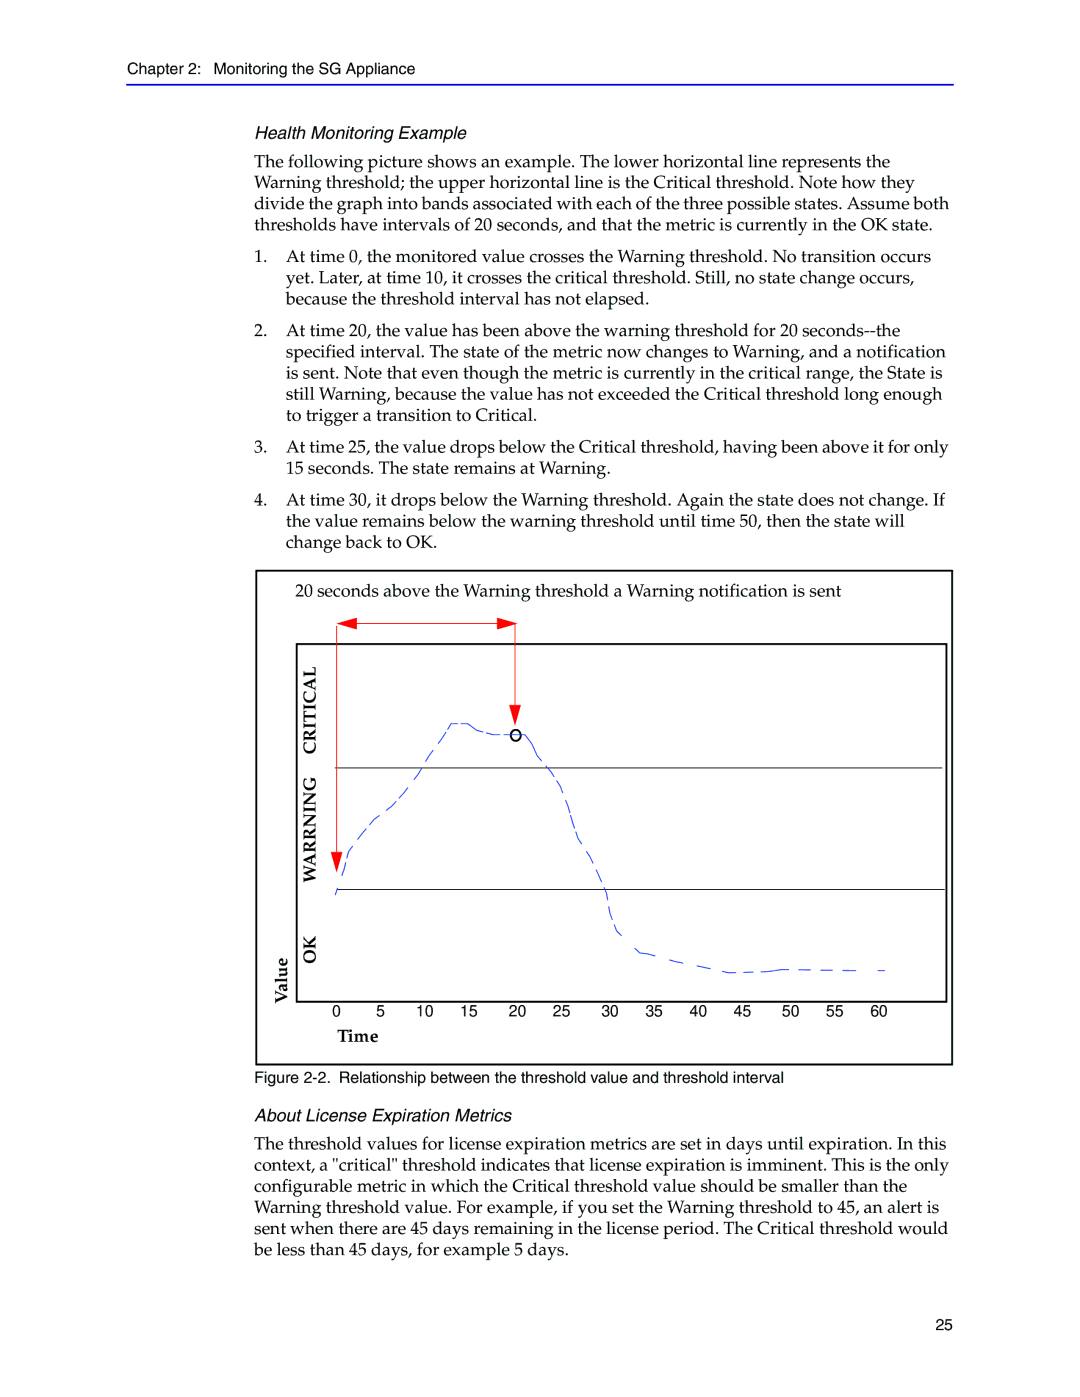
The following picture shows an example. The lower horizontal line represents the Warning threshold; the upper horizontal line is the Critical threshold. Note how they divide the graph into bands associated with each of the three possible states. Assume both thresholds have intervals of 20 seconds, and that the metric is currently in the OK state.
1.At time 0, the monitored value crosses the Warning threshold. No transition occurs yet. Later, at time 10, it crosses the critical threshold. Still, no state change occurs, because the threshold interval has not elapsed.
2.At time 20, the value has been above the warning threshold for 20
3.At time 25, the value drops below the Critical threshold, having been above it for only 15 seconds. The state remains at Warning.
4.At time 30, it drops below the Warning threshold. Again the state does not change. If the value remains below the warning threshold until time 50, then the state will change back to OK.
| 20 seconds above the Warning threshold a Warning notification is sent |
| |||||||||||
| CRITICAL |
|
|
|
|
|
|
|
|
|
|
|
|
| WARRNING |
|
|
|
|
|
|
|
|
|
|
|
|
Value | OK | 5 | 10 | 15 | 20 | 25 | 30 | 35 | 40 | 45 | 50 | 55 | 60 |
| 0 | ||||||||||||
| Time |
|
|
|
|
|
|
|
|
|
|
| |
Figure 2-2. Relationship between the threshold value and threshold interval
About License Expiration Metrics
The threshold values for license expiration metrics are set in days until expiration. In this context, a "critical" threshold indicates that license expiration is imminent. This is the only configurable metric in which the Critical threshold value should be smaller than the Warning threshold value. For example, if you set the Warning threshold to 45, an alert is sent when there are 45 days remaining in the license period. The Critical threshold would be less than 45 days, for example 5 days.
25
