Volume 9: Managing the Blue Coat SG Appliance
System health is determined by calculating the “aggregate” health status of the following metrics:
❐CPU Utilization
❐Memory Pressure
❐Network interface utilization
❐Disk status (for all disks)
❐License expiration
❐License “user count” utilization (when applicable)
❐ADN status
The possible health states are OK, Warning, or Critical.
Clicking the health icon displays the Statistics > Health page, which lists the current condition of the system’s health monitoring metrics, as described in the next section.
Viewing Health Monitoring Statistics
While the health icon presents a quick view of the appliance health, the Statistics > Health Monitoring page enables you to get more details about the current state of the health monitoring metrics.
To review the health monitoring statistics:
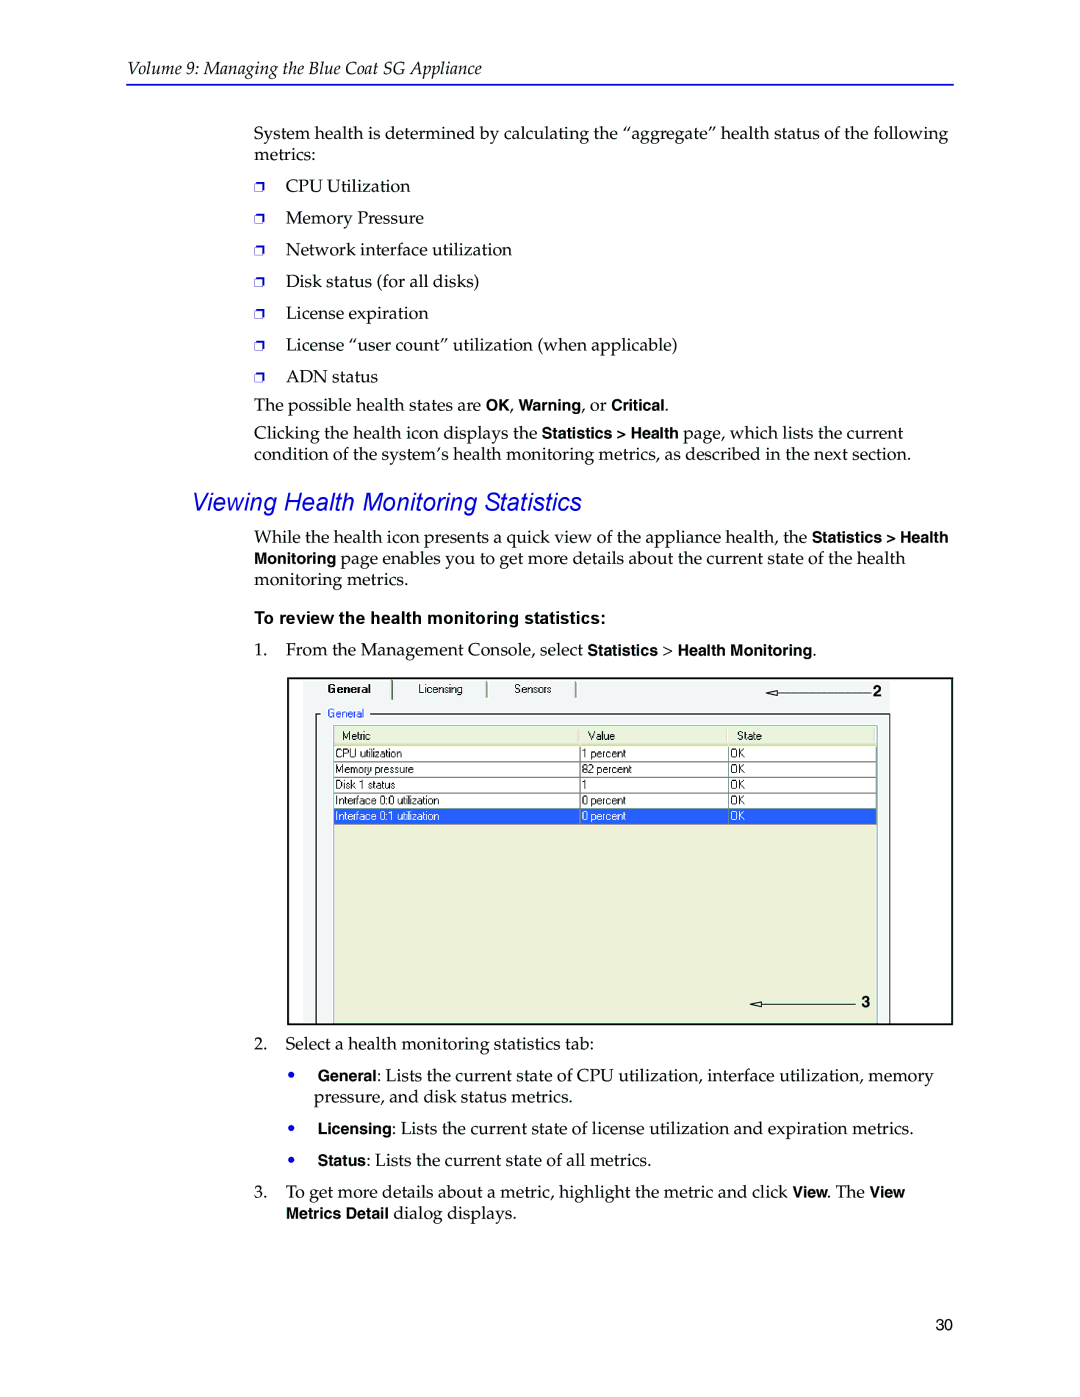
1.From the Management Console, select Statistics > Health Monitoring.
2
3
2.Select a health monitoring statistics tab:
•General: Lists the current state of CPU utilization, interface utilization, memory pressure, and disk status metrics.
•Licensing: Lists the current state of license utilization and expiration metrics.
•Status: Lists the current state of all metrics.
3.To get more details about a metric, highlight the metric and click View. The View Metrics Detail dialog displays.
30