Chapter 5: Statistics
The Statistics tabs of the Management Console allow you to view the status of many system operations. Many statistics are available through the CLI, but only in text output.
You can also view detailed system information through the CLI using the show command. Access this command through either the enable command prompt (SGOS#) or the config command prompt (SGOS#(config)). For convenience, the procedures in this chapter show only the enable command prompt. See “Using the CLI show Command to View Statistics” on page 88 for information about using the show command.
This chapter includes the following topics:
❐“Viewing Traffic Distribution Statistics” on page 62
❐“Viewing Traffic History” on page 65
❐“Viewing the ADN History” on page 68
❐“Viewing Bandwidth Management Statistics” on page 68
❐“Viewing Protocol Statistics” on page 68
❐“Viewing System Statistics” on page 70
❐“Viewing Traffic Distribution Statistics” on page 62
❐“Active
❐“Viewing the Access Log” on page 87
❐“Viewing Advanced Statistics” on page 87
Selecting the Graph Scale
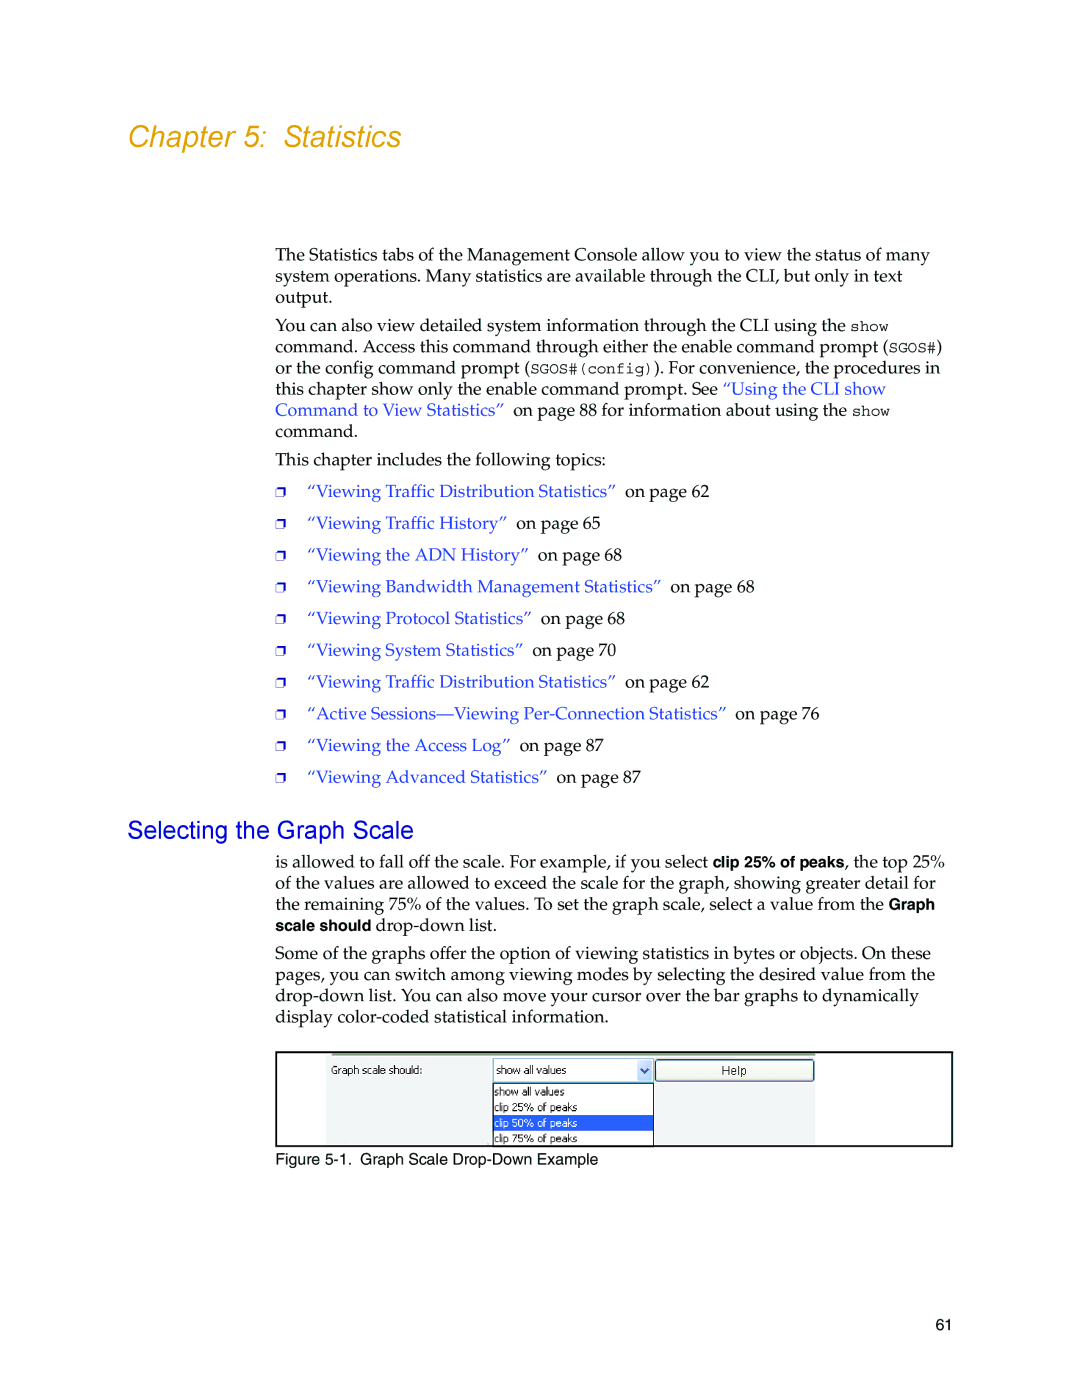
is allowed to fall off the scale. For example, if you select clip 25% of peaks, the top 25% of the values are allowed to exceed the scale for the graph, showing greater detail for the remaining 75% of the values. To set the graph scale, select a value from the Graph scale should
Some of the graphs offer the option of viewing statistics in bytes or objects. On these pages, you can switch among viewing modes by selecting the desired value from the
Figure 5-1. Graph Scale Drop-Down Example
61