Chapter 5: Statistics
Note: Endpoint Mapper proxy bytes are the result of Microsoft Remote Procedure Call (MSRPC) communication for MAPI traffic.
Understanding Chart Data
The chart data updates automatically every 60 seconds. The units for the X and Y axis change according to the selected duration. For example, if you select "Last Week,” the
The word "Hit" can display at the top of the BW Gain graph if the gain was the result of a cache hit.
The colors in the bandwidth usage and bandwidth gain charts represent the following information:
❐
❐
❐
❐Dark
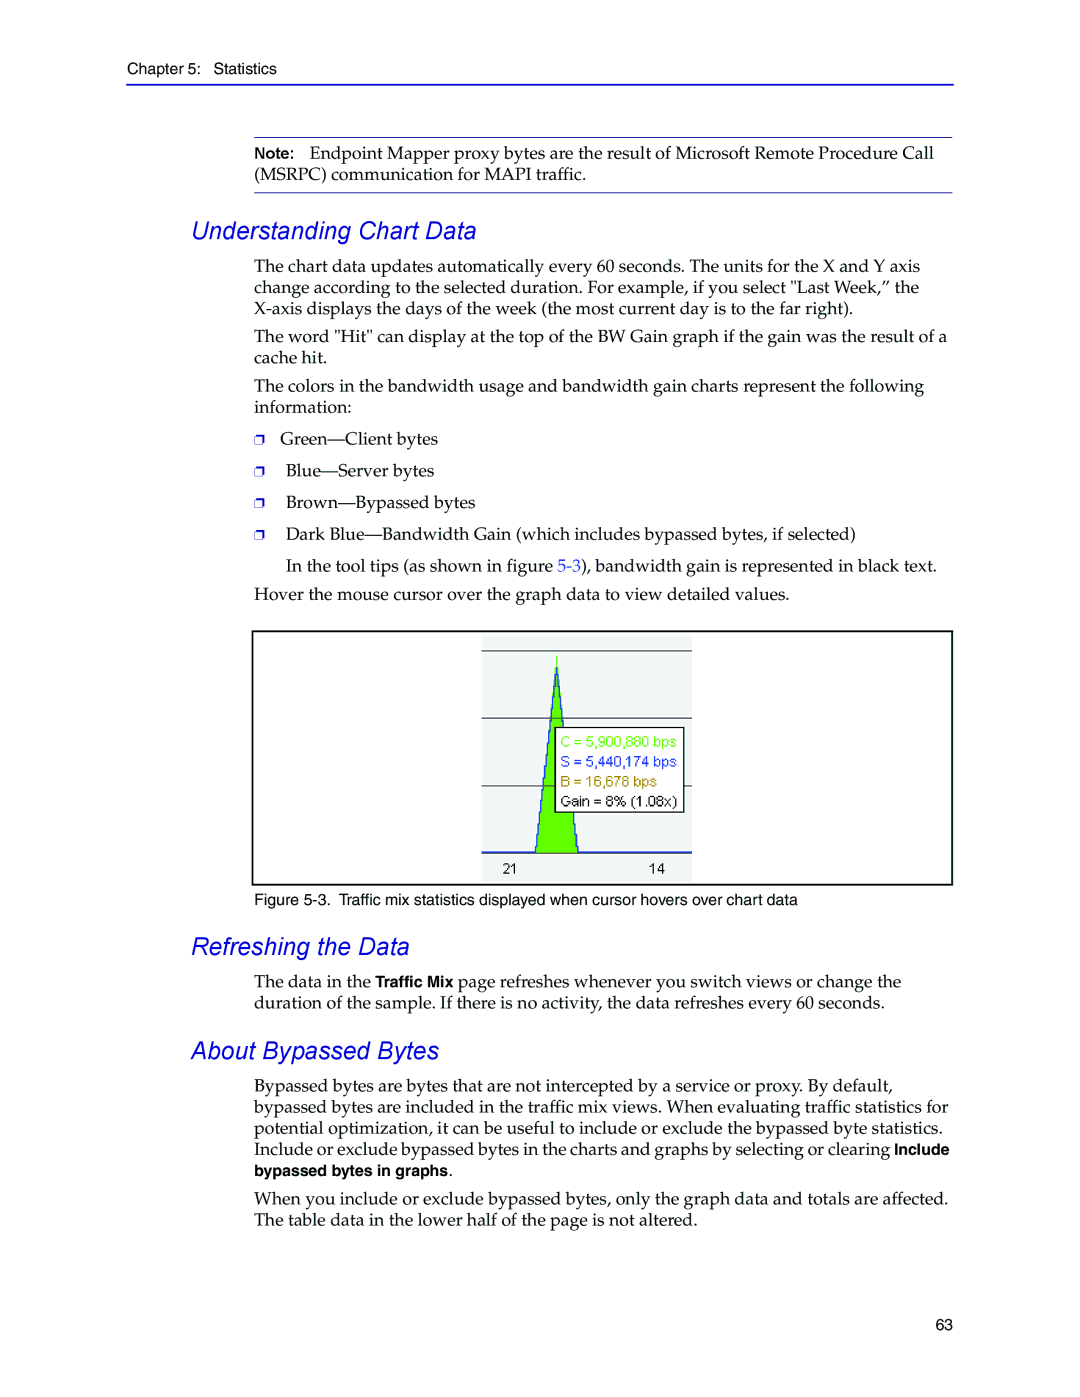
In the tool tips (as shown in figure
Hover the mouse cursor over the graph data to view detailed values.
Figure 5-3. Traffic mix statistics displayed when cursor hovers over chart data
Refreshing the Data
The data in the Traffic Mix page refreshes whenever you switch views or change the duration of the sample. If there is no activity, the data refreshes every 60 seconds.
About Bypassed Bytes
Bypassed bytes are bytes that are not intercepted by a service or proxy. By default, bypassed bytes are included in the traffic mix views. When evaluating traffic statistics for potential optimization, it can be useful to include or exclude the bypassed byte statistics. Include or exclude bypassed bytes in the charts and graphs by selecting or clearing Include bypassed bytes in graphs.
When you include or exclude bypassed bytes, only the graph data and totals are affected. The table data in the lower half of the page is not altered.
63
