Chapter 4: Diagnostics
Diagnostic Reporting (CPU Monitoring)
You can enable CPU monitoring whenever you want to see the percentage of CPU being used by specific functional groups. For example, if you look at the CPU consumption and notice that compression/decompression is consuming most of the CPU, you can change your policy to compress/decompress more selectively.
Note: CPU monitoring uses about
To configure and view CPU monitoring:
1.Select Statistics > Advanced.
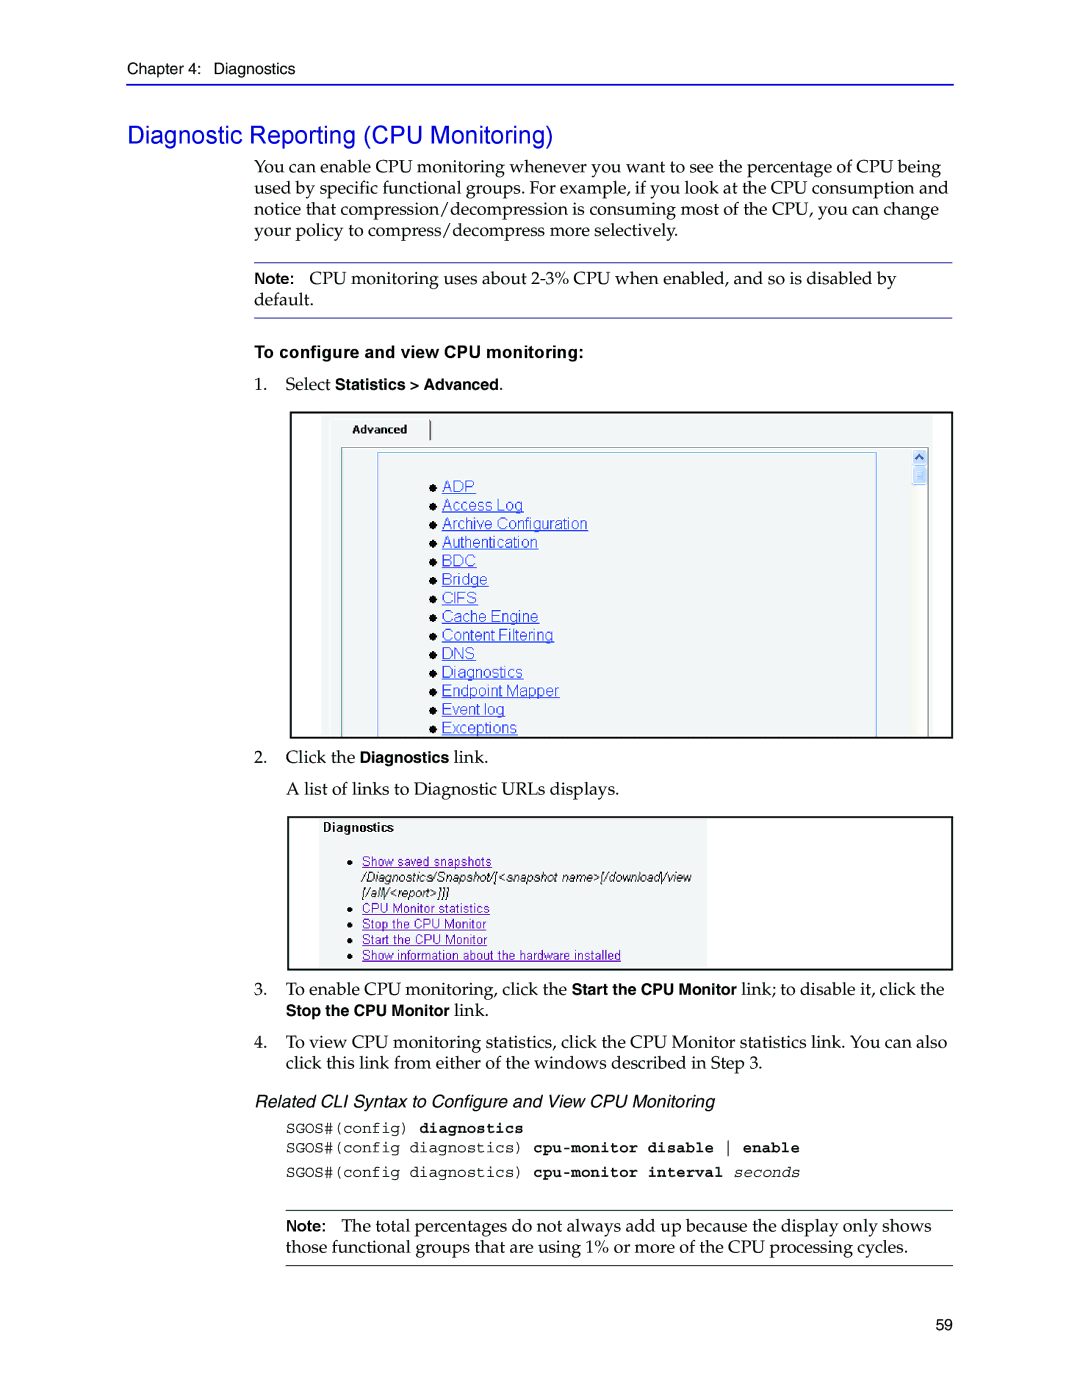
2.Click the Diagnostics link.
A list of links to Diagnostic URLs displays.
3.To enable CPU monitoring, click the Start the CPU Monitor link; to disable it, click the
Stop the CPU Monitor link.
4.To view CPU monitoring statistics, click the CPU Monitor statistics link. You can also click this link from either of the windows described in Step 3.
Related CLI Syntax to Configure and View CPU Monitoring
SGOS#(config) diagnostics
SGOS#(config diagnostics)
SGOS#(config diagnostics)
Note: The total percentages do not always add up because the display only shows those functional groups that are using 1% or more of the CPU processing cycles.
59