Volume 9: Managing the Blue Coat SG Appliance
About the Default Service Statistics
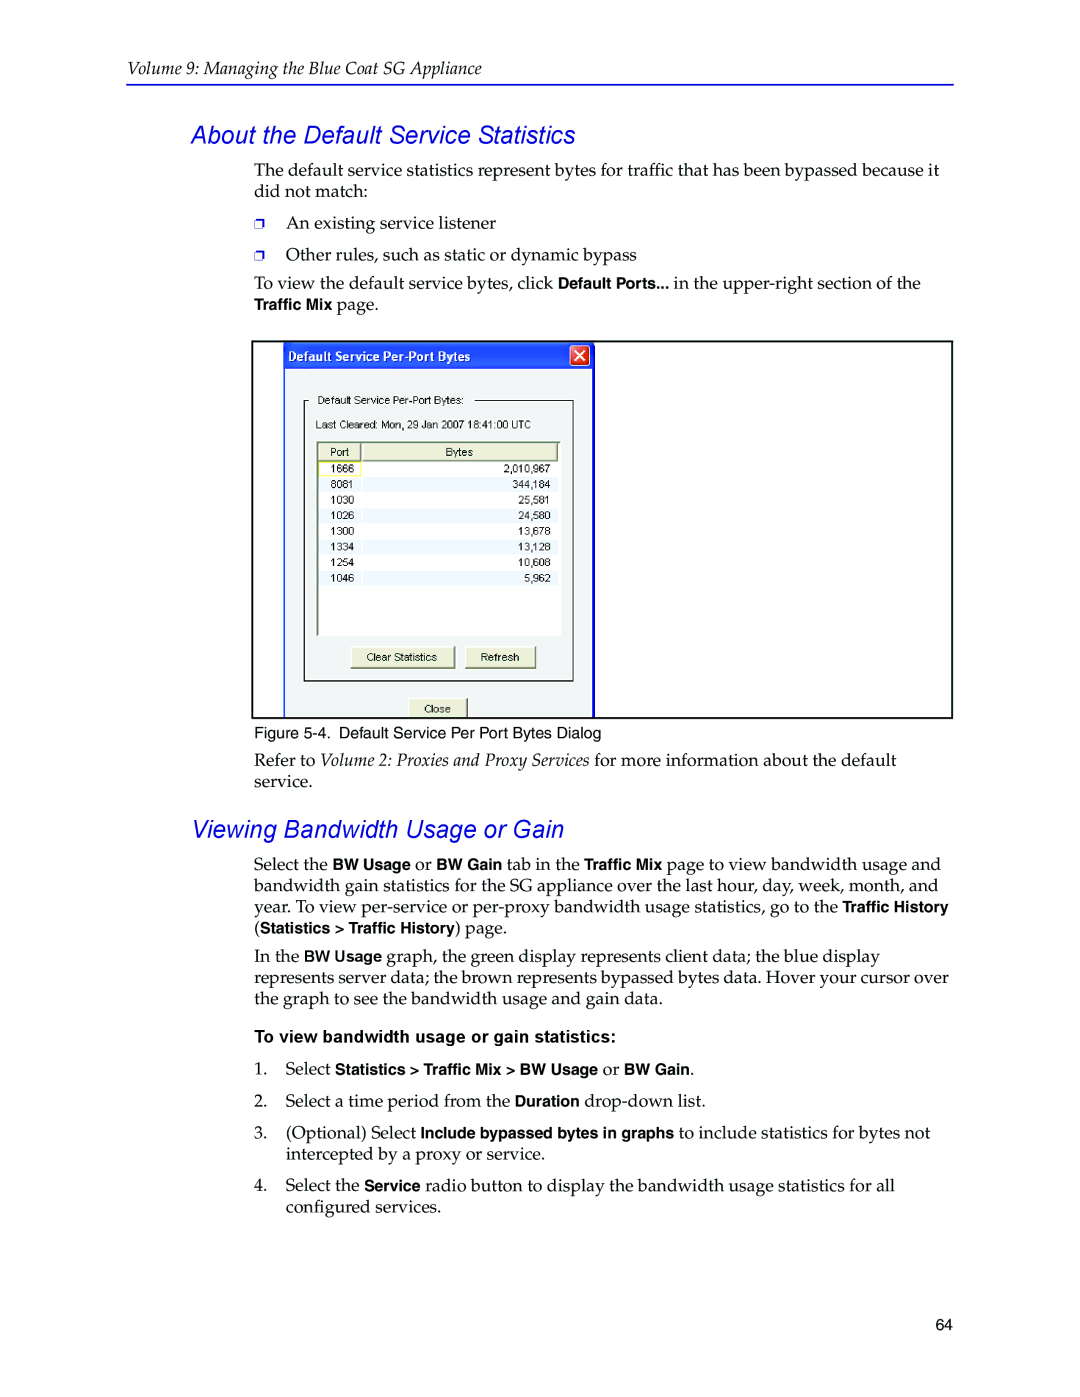
The default service statistics represent bytes for traffic that has been bypassed because it did not match:
❐An existing service listener
❐Other rules, such as static or dynamic bypass
To view the default service bytes, click Default Ports... in the
Figure 5-4. Default Service Per Port Bytes Dialog
Refer to Volume 2: Proxies and Proxy Services for more information about the default service.
Viewing Bandwidth Usage or Gain
Select the BW Usage or BW Gain tab in the Traffic Mix page to view bandwidth usage and bandwidth gain statistics for the SG appliance over the last hour, day, week, month, and year. To view
In the BW Usage graph, the green display represents client data; the blue display represents server data; the brown represents bypassed bytes data. Hover your cursor over the graph to see the bandwidth usage and gain data.
To view bandwidth usage or gain statistics:
1.Select Statistics > Traffic Mix > BW Usage or BW Gain.
2.Select a time period from the Duration
3.(Optional) Select Include bypassed bytes in graphs to include statistics for bytes not intercepted by a proxy or service.
4.Select the Service radio button to display the bandwidth usage statistics for all configured services.
64