Chapter 2: Monitoring the SG Appliance

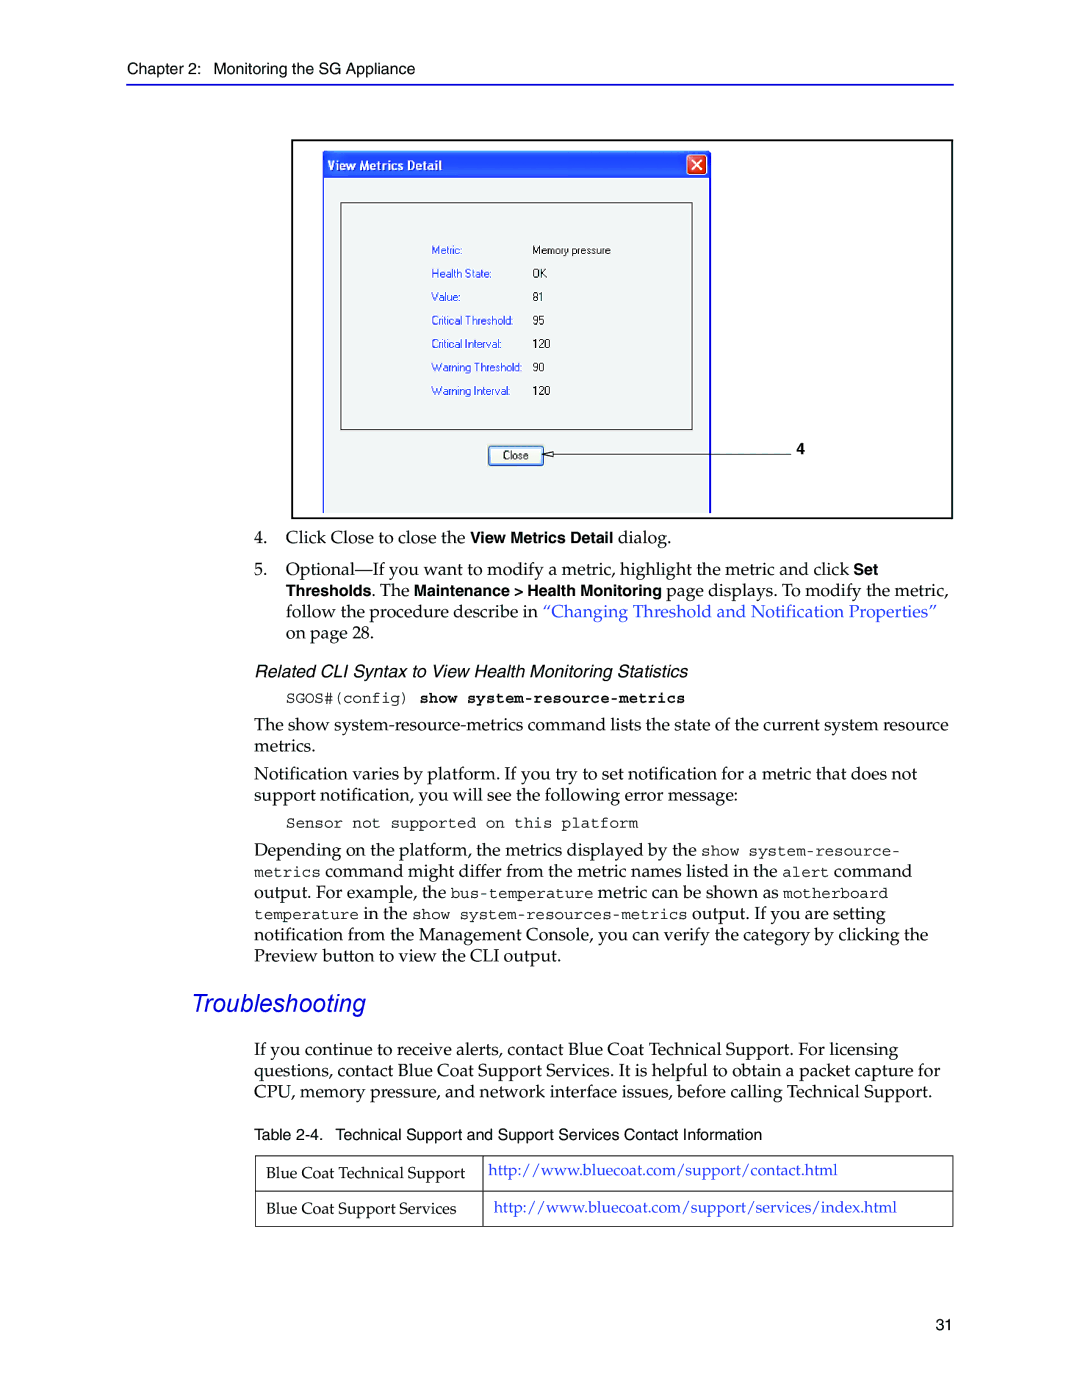
4

4.Click Close to close the View Metrics Detail dialog.

5.Optional—If you want to modify a metric, highlight the metric and click Set Thresholds. The Maintenance > Health Monitoring page displays. To modify the metric, follow the procedure describe in “Changing Threshold and Notification Properties” on page 28.

Related CLI Syntax to View Health Monitoring Statistics

SGOS#(config) show system-resource-metrics

The show system-resource-metrics command lists the state of the current system resource metrics.

Notification varies by platform. If you try to set notification for a metric that does not support notification, you will see the following error message:

Sensor not supported on this platform

Depending on the platform, the metrics displayed by the show system-resource- metrics command might differ from the metric names listed in the alert command output. For example, the bus-temperaturemetric can be shown as motherboard temperature in the show system-resources-metricsoutput. If you are setting notification from the Management Console, you can verify the category by clicking the Preview button to view the CLI output.

Troubleshooting

If you continue to receive alerts, contact Blue Coat Technical Support. For licensing questions, contact Blue Coat Support Services. It is helpful to obtain a packet capture for CPU, memory pressure, and network interface issues, before calling Technical Support.

Table 2-4. Technical Support and Support Services Contact Information

Blue Coat Technical Support

http://www.bluecoat.com/support/contact.html


Blue Coat Support Services

http://www.bluecoat.com/support/services/index.html


31

Page 31
Image 31
Blue Coat Systems Blue Coat Systems SG Appliance Troubleshooting, Related CLI Syntax to View Health Monitoring Statistics