Volume 9: Managing the Blue Coat SG Appliance
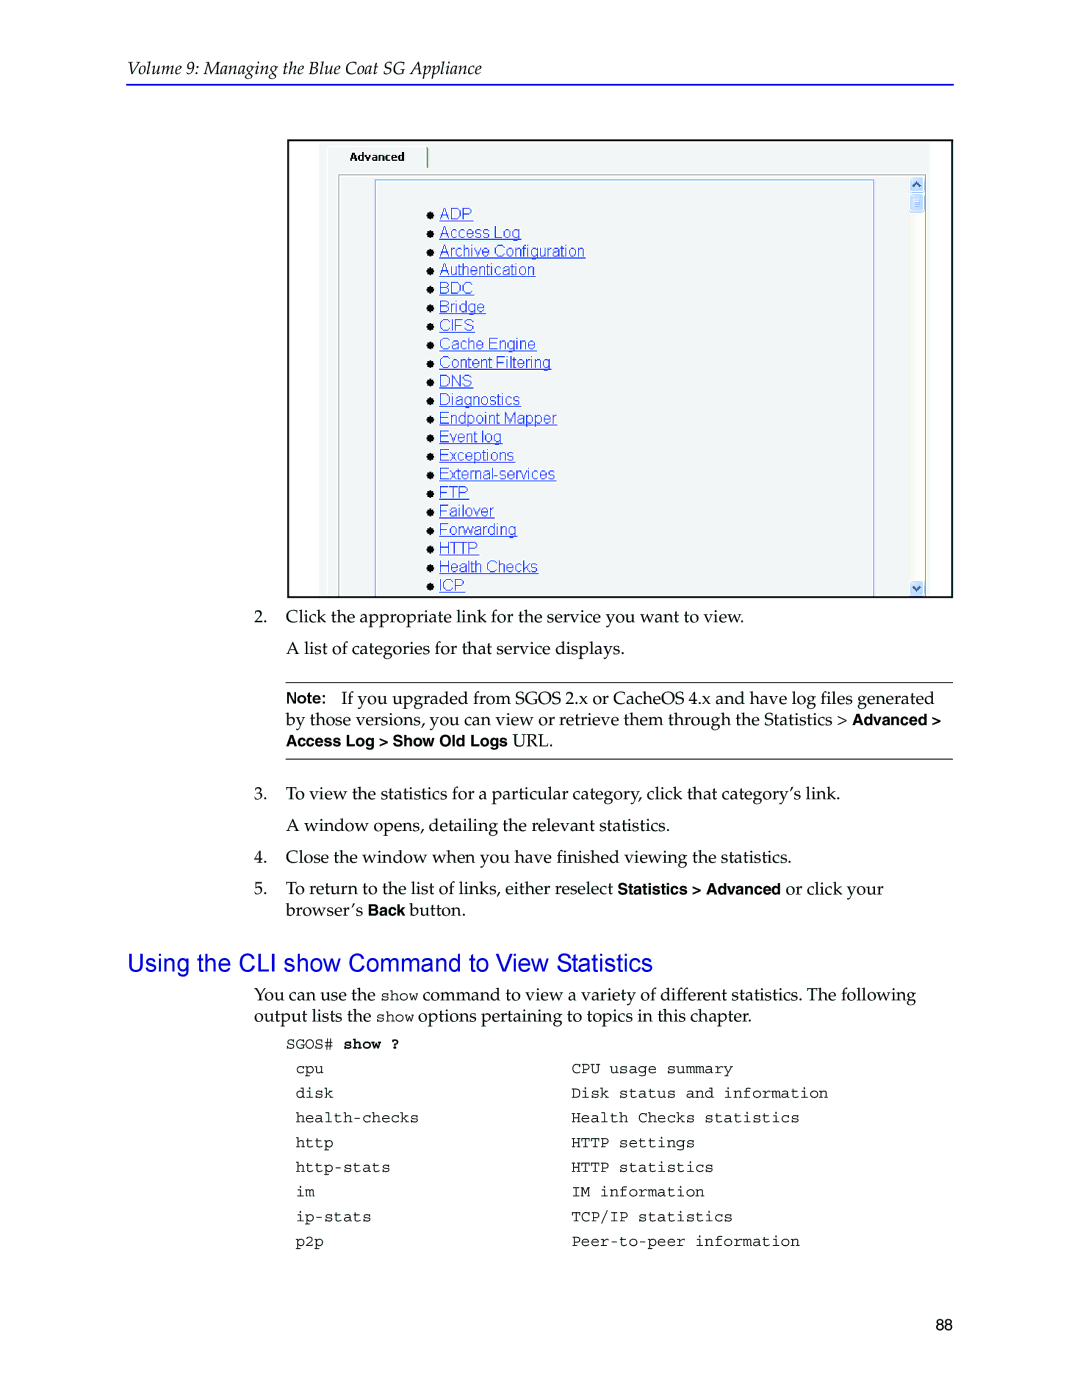
2.Click the appropriate link for the service you want to view. A list of categories for that service displays.
Note: If you upgraded from SGOS 2.x or CacheOS 4.x and have log files generated by those versions, you can view or retrieve them through the Statistics > Advanced > Access Log > Show Old Logs URL.
3.To view the statistics for a particular category, click that category’s link. A window opens, detailing the relevant statistics.
4.Close the window when you have finished viewing the statistics.
5.To return to the list of links, either reselect Statistics > Advanced or click your browser’s Back button.
Using the CLI show Command to View Statistics
You can use the show command to view a variety of different statistics. The following output lists the show options pertaining to topics in this chapter.
SGOS# show ? |
|
cpu | CPU usage summary |
disk | Disk status and information |
Health Checks statistics | |
http | HTTP settings |
HTTP statistics | |
im | IM information |
TCP/IP statistics | |
p2p |
88
