Chapter 5: Statistics
Table
Column Heading | Description | ||
|
| ||
Server Bytes | Represents the number of bytes (to and from the server) at the socket | ||
| level on the server connection. All | ||
| including application overhead such as HTTP headers, CIFS headers, | ||
| and so on. | ||
| If the traffic is flowing through an ADN tunnel, the bytes are counted | ||
| after ADN optimization, meaning that compressed byte counts are | ||
| displayed. | ||
| TCP and IP headers, packet retransmissions, and duplicate packets are | ||
| not counted. | ||
| See “About the Byte Totals” on page 83 for more information. | ||
|
| ||
Gain | Displays the bandwidth gain for the session. The calculation is: | ||
| (Client Bytes - Server Bytes)/ Server Bytes | ||
| When the request results in a pure cache hit, this column displays | ||
| Cache Hit. | ||
|
| ||
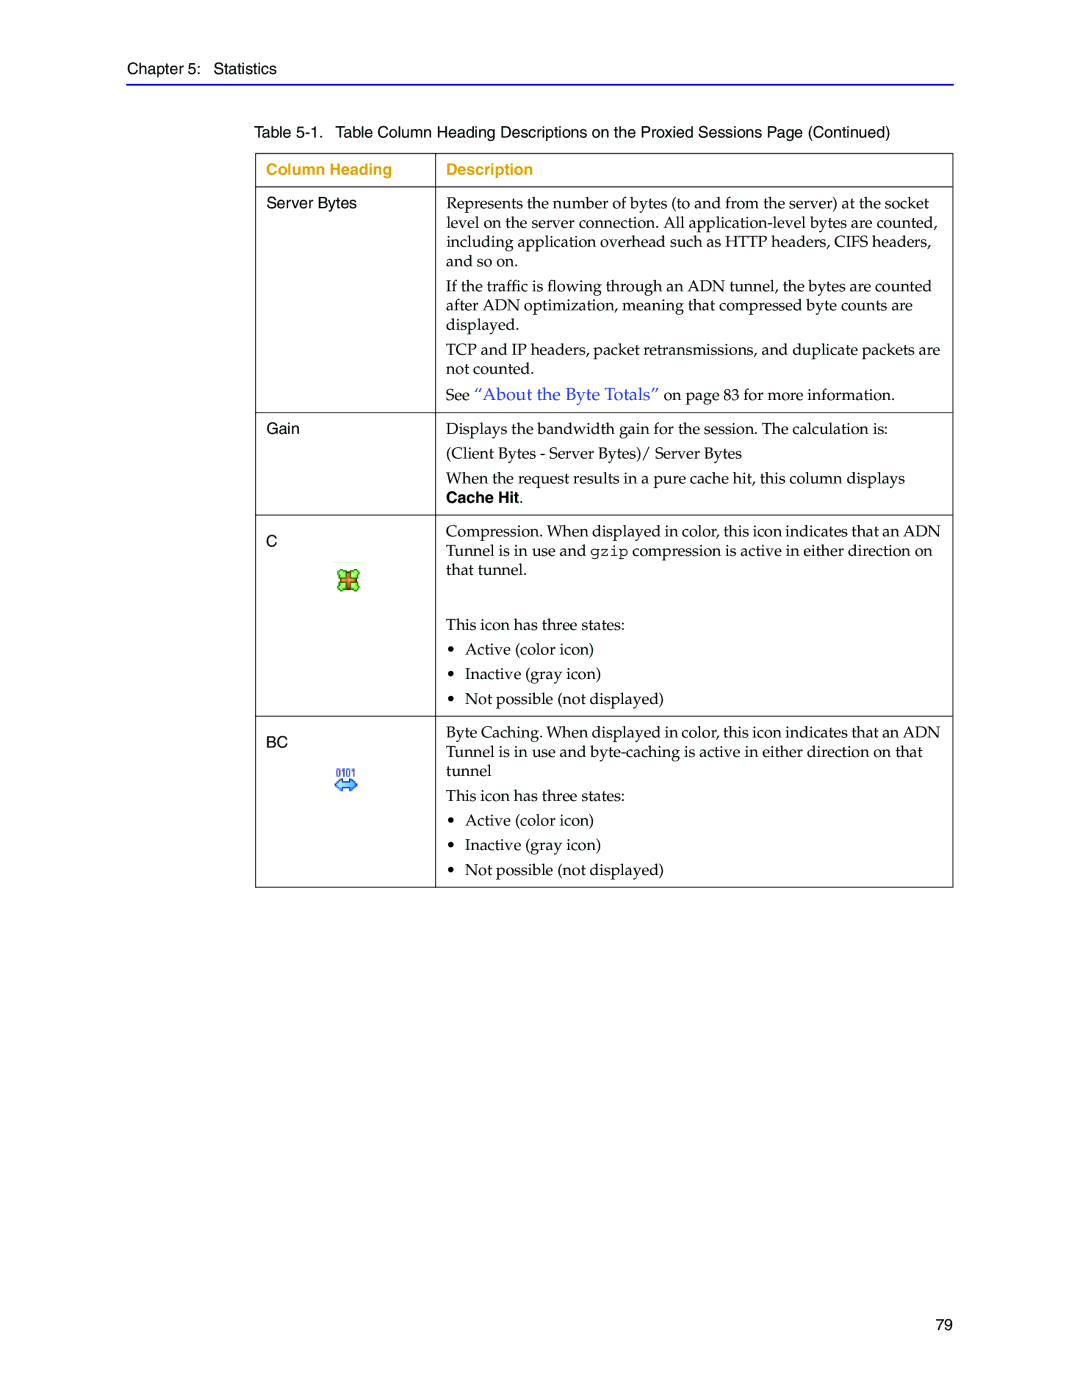
C | Compression. When displayed in color, this icon indicates that an ADN | ||
Tunnel is in use and gzip compression is active in either direction on | |||
| |||
| that tunnel. | ||
| This icon has three states: | ||
| • | Active (color icon) | |
| • | Inactive (gray icon) | |
| • | Not possible (not displayed) | |
|
| ||
BC | Byte Caching. When displayed in color, this icon indicates that an ADN | ||
Tunnel is in use and | |||
| |||
| tunnel | ||
| This icon has three states: | ||
| • | Active (color icon) | |
| • | Inactive (gray icon) | |
| • | Not possible (not displayed) | |
|
|
| |
79
