Volume 9: Managing the Blue Coat SG Appliance
Failover Statistics
At any time, you can view statistics for any failover group you have configured on your system.
To view failover statistics:
1.Select Statistics > System > Failover.
2.From the Failover Group
The information displayed includes the multicast address, the local address, the state, and any flags, where V indicates that the group name is a virtual IP address, R indicates that the group name is a physical IP address, and M indicates that this machine can be configured to be the master if it is available.
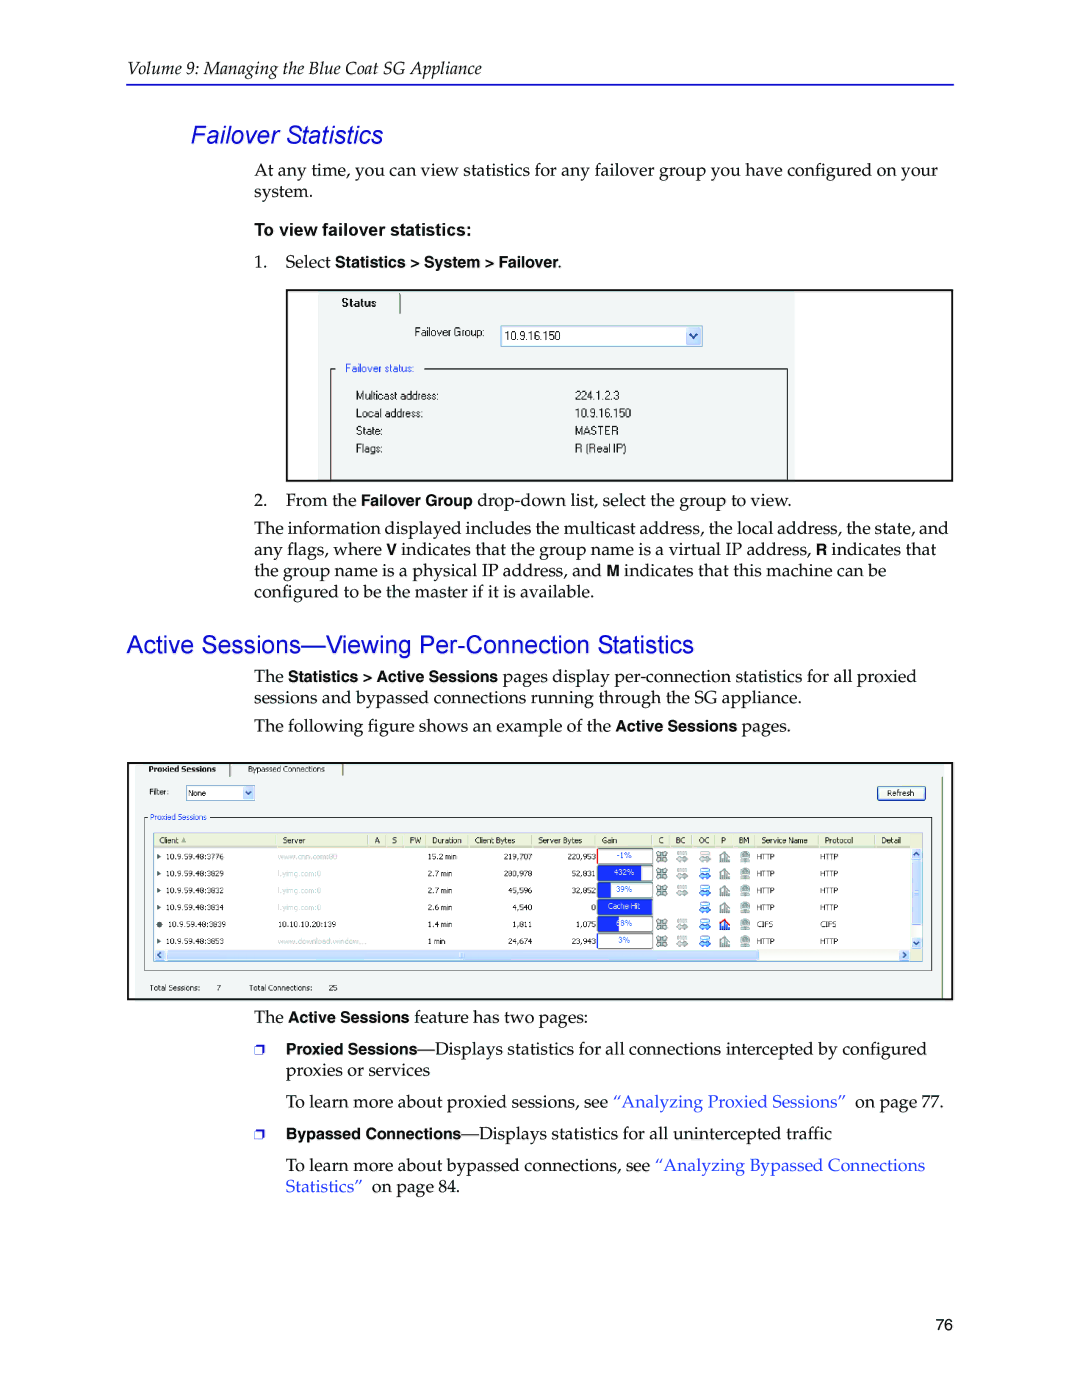
Active Sessions—Viewing Per-Connection Statistics
The Statistics > Active Sessions pages display
The following figure shows an example of the Active Sessions pages.
The Active Sessions feature has two pages:
❐Proxied
To learn more about proxied sessions, see “Analyzing Proxied Sessions” on page 77.
❐Bypassed
To learn more about bypassed connections, see “Analyzing Bypassed Connections Statistics” on page 84.
76