SmartSwitch
Page
Copyrights and Disclaimers
About This Manual
Screen Displays
SmartSwitch 1800 4 User Guide, Rev
Table of Contents
Chapter Configuring Frame Relay
Configuring BSC Interactive
Configuring IP Routing
Section Operation
Section Appendices
List of Figures
Remote SmartSwitch 1800 in Configuration Example
10-3
13-11
List of Tables
Frame Relay Backup Group Parameters
10-5
16-8
Section I Getting Started
Page
Network Example
Chapter Product Overview
SNA/SDLC SNA/LLC2
Hardware Overview
Voice Models of SmartSwitch
Models
Operator Interfaces
User Interfaces
Quick Start
Chapter Getting Started
Port Assignments for Voice Models
Port Assignment Worksheet
Port Assignments for Data-Only Models
Physical Port Locations on Data-Only Models
Port Status Display
Loggin into the Main Menu
Main Menu
Reviewing Boot Messages
Prompts
Moving Through the Menus
On-Line Help
F4 Exit menu or Delete Record or Clear Max Stats
Function Keys on an Ascii Terminal
Changing the Login Password
Setting the Date and Time
Date and Time Parameters
Stopping Operation
Rebooting
What Next?
Logging Out
Section II Configuration
Page
Database Setup Recommendations
Chapter Introduction to Database Configuration
Serial Protocols over Frame Relay via Logical Ports
Configuration Examples
LLC2 PUs over Frame Relay to AS/400
Frame Relay PVC Passthrough
Local SmartSwitch 1800 in Configuration Example
Key Points
Remote SmartSwitch 1800 in Configuration Example
Received from Forwarded to Action taken
MAC Address Conversion
3x74s/SDLC over Frame Relay to SNA Host
Key Points
REPORT.TXT
Producing a Configuration Report
Where to Find Configuration Information
On-Line Update IPX Filter Definitions and Applications
Configure BSC Devices Chapter
Introduction to Database Configuration
Page
Node Defaults Configuration Screen
Chapter Configuring Node Defaults
Database and System Memory Values
Node Defaults Parameters
Node Defaults Parameters
Remote Control Pwd
Secondary Alarm Output ID
NetView Parameters
NetView Parameters
As specified here in the NetView parameters
SmartSwitch 1800 4 User Guide, Rev
Prio rity
Page
Chapter Loading Protocols
Protocol Configuration Menu
Press F10
Protocol Parameters
Locations of Physical Ports
Chapter Configuring Physical Ports
Physical Ports on Data-Only Models
Default Configuration Screen for New Port
Configuring a Serial or Voice Port
Database and System Memory Values
Configuring the Port Parameters
LAN Card Parameters
Configuring a LAN Port
LAN Card Parameters
Page
Introduction
FRM Configuring Frame Relay
Dlci Sharing
Frame Relay Backup
Example
Frame Relay Backup Examples
Port Configuration A, C, a from Main Menu for the backup
Required Configuration
Configuring Bandwidth Allocation Groups
Bandwidth Allocation Group Parameters
Bandwidth Allocation Group Parameters
Bandwidth Allocation Example
Configuration Example
Frame Relay Port Screen
Configuring Frame Relay Ports
Dlci Configuration Review Screen
Reviewing Dlci Configuration -4, Item C
Parameters in the second line are
Frame Relay Dlci Configuration Screen
Configuring Dlci Parameters -4, Item D
Viewing Learned DLCIs -4, Item E
Frame Relay Port Parameters
Frame Relay Port Parameters
CIR
Frame Relay Dlci Parameters
Blocked Port Flag
Rcv Clock TT from DTE
Dlci Parameters
Dlci cannot be both a backup and a primary
Frame Relay PVC Configuration
Configuring Frame Relay PVCs Across the Node
Frame Relay PVC Parameters
Frame Relay PVC Parameters
Backup Group Parameters
Configuring Frame Relay Backup Groups
Frame Relay Backup Group Parameters
ProtEnab
Page
Chapter Configuring
X.25 Port Screen
Configuring a Physical X.25 Port
X.25 Port CUG Parameters
Configuring Closed User Groups
X.25 Port Trunk Parameters
Configuring a Network Trunk
Physical X.25 Port Parameters
Configuring a Dial Port
Physical X.25 Port Parameters
CUG Parameters
Port Type
Modulo
Channel Valid Values
Incoming Calls Barred
Dial Port Parameters
CUG Parameters
Logical Port Screen
Configuring a Logical X.25 Port
Logical Port Parameters
Logical Port Parameters
Mapped Dlci Number
Priority
Lowest/Highest Incoming/Two -Way/Outgoing Channel
Local Charging Prevention
Valid values in bits per second are
Closed User Group Parameters
Typical SVC Subscriber Screen
Configuring Subscriber IDs
Wildcards in Subscriber Addresses
Subscriber Addressing
Search Order for Subscriber Addresses
Hunt Group Example
Configuring
Subscriber Parameters
Subscriber Parameters
Identify the RLPs and ports that make up the routing paths
Backup Using Address Translation
Configuring X.25 Address Translation Templates
Address Translation Templates Display
Translation Template Parameters
Translation Template Parameters
Replacing Called/Calling Address or User Data
Replacing Facilities
Replacing Protocol ID
Translation Examples
11 Address Translation Test Screen
Testing a Translation Template
12 X.25-to-X.25 PVC Screen
Configuring X.25-to-X.25 PVCs
PVC Parameters
PVC Parameters
Page
Chapter Configuring SNA
SmartSwitch 1800 4 User Guide, Rev
SDLC/LLC2 Examples
SNA Port Screen
Configuring an SNA Port
Sdlc PU Subscriber Parameters Screen
SNA Port Parameters
SNA Port Parameters
Indefinite
SNA Port PU Parameters
No Data Poll Period
NRZ
PU Subscriber Parameters
LLC2 Parameters
Idblk
Suppress XIDs
Configuring Subscriber Addresses
SVC Subscriber Parameters
See Configuring a Hunt Group for SNA Subscribers
Configuring a Hunt Group for SNA Subscribers
Configuring an LLC2 Virtual LAN ID
LLC2 Defaults Configuration Screen
Configuring LLC2 Hosts
LLC2 Originated Host Configuration Screen
LLC2 Host Connections Screen
LLC2 Host Parameters
LLC2 Host Parameters
Digit Convert to Digit Using the example
Configuring SNA
Priority
Connections Parameters
LLC2 Interfaces Display
Configuring LLC2 Interfaces
10 Bridge Port/LLC2 Interface Record, Ethernet
Bridge Port/LLC2 Interface Parameters
LLC2 Interface Parameters
Identifies the physical port containing the interface
LAN ID
Chapter Configuring BSC Interactive
BSC Interactive Port Record
Configuring BSC Interactive Port Records
BSC Interactive Port Record, Screen
BSC Interactive Port Parameters
BSC Interactive Port Parameters
BSC Interactive Port Subscriber Parameters
Explanations of Port Parameters
Activate Connection w/o poll
Specifies the time between passes through the polling list
Explanations of Subscriber Parameters
Routing Algorithm System atic Redirection
Logical port
10-10
Configuring BSC Interactive Devices
Control and Device Unit Addressing
BSC Interactive Devices Screen
BSC Interactive Device Parameters
BSC Interactive Device Parameters
Chapter Configuring BSC Batch
BSC Batch Port Record
Configuring BSC Batch Ports
BSC Batch Port Parameters
BSC Batch Port Parameters
BSC Batch Port Parameters
ETB = End of transmission block, ETX = End of text
= 2780 C = 3780 D = 3740 E =
Subscriber Parameters
11-8
Configuring BSC Batch 11-9
11-10
Chapter Configuring Async Ports
Configuring Async PAD Profiles
Async PAD Profile Parameters
PAD Profile Parameters
02, Echo
08, Discard Output
17, Line Delete
Login Parameters
Configuring Async PAD Login Parameters
Async PAD Login Parameters
Async PAD Port Screen
Configuring Async Port Records
Async Port Parameters
Async PAD Port Parameters
Async Port Parameters
Initial Profile Name
Is the time between autocall attempts
Disconnect Duration
= normal = Hpad
Configuring Async Ports 12-15
12-16
Configuring Abbreviated Addresses
Async-to-X.25 PVC Record
Configuring Async PVCs
Async PVC Parameters
Async PVC Parameters
Page
Chapter Configuring Voice
Voice Configuration Menu
Voice Configuration Menu
Voice System-Level Parameters
Configuring Voice System-Level Parameters
Country Code
International Dialing Country Codes
International Dialing Country Codes
Speed-Dial Map Configuration Menu
Reviewing and Configuring the Speed-Dial Map Table
Speed-Dial Map Parameters
Speed-Dial Map Configuration Parameters
Voice Ports
Configuring Voice Ports
Voice Port Parameters
Voice Port Parameters
Is the delay after which the E&M E lead follows the M lead
Front Panel Switches
Switch Settings
Long Dial Prefix
Auto Dial Parameters
Enhanced Dialing Parameters
From the map table or dialed by the user is specified by
Dtmf on Duration
Reviewing and Configuring Voice Interfaces
Voice Interface Parameters
Voice Interface Configuration Parameters
Is the Voice port in the local SmartSwitch
IP Addressing
Chapter Configuring IP Routing
Subnet Addressing
Using the Node as an IP Gateway
IP Node Defaults Menu
Configuring IP Node Defaults
IP Node Defaults Parameters
Configuring IP Interfaces
IP Node Defaults Parameters
IP Interface Record Frame Relay Example
LAN IP Interface Secondary Address Configuration
Frame Relay IP Interface Parameters
IP Interface Parameters
IP Address first, then the Network Mask
X.25 IP Interface Parameters
Secondary Address Parameters
Ethernet/Token Ring IP Interface Parameters
Descriptions of Parameters Common to all Interface Types
Source Port/DLCI
Descriptions of Parameters Specific to X.25 Interfaces
Secondary Address Parameters
Descriptions of Parameters Specific to LAN Interfaces
IP Routing Record
Configuring Static IP Routes
IP Routing Parameters
IP Routing Parameters
Page
Chapter Configuring IPX
IPX Node Defaults Parameters
Configuring IPX Node Defaults
IPX Node Defaults Parameters
Configuring IPX Filter Definitions
Configuring IPX Filters
IPX SAP Filter Record
How Filter Masks Work
IPX RIP Filter Parameters
IPX Filter Parameters
IPX SAP Filter Parameters
IPX Packet Filter Parameters
IPX RIP Router Filter Parameters
Typical IPX Filter Applications Record
Configuring IPX Filter Applications
IPX Filter Applications Parameters
Configuring IPX Interfaces
IPX Filter Applications Parameters
Frame Relay Interface Parameters
IPX Interface Parameters
IPX Frame Relay Interface Parameters
IPX X.25 Interface Parameters
Interface Parameters
IPX LAN Interface Parameters
LAN Interface Parameters
Parameter Descriptions
Ipxwan
Serialization Enabled
15-16
Configuring Static IPX Routes
10 IPX RIP Static Route Parameters
IPX RIP Static Route Parameters
11 IPX SAP Static Route Parameters
IPX SAP Static Route Parameters
Configuring IPX 15-19
Page
Chapter Configuring Bridging
16-2
Bridge Node Defaults Configuration Screen
Configuring Default Node-Wide Bridging Parameters
Bridge Node Default Parameters
Bridge Node Default Parameters
SRB ID
Configuring Filter Definitions
Configuring Bridge Filters
How Filter Masks Work
Bridge MAC Filter Configuration Screen
Bridge Generic Filter Parameters
Bridge Filter Definition Parameters
Bridge MAC Filter Parameters
Bridge Protocol Filter Parameters
Bridge SAP Filter Parameters
Bridge NetBIOS Filter Parameters
Configuring Bridge Filter Applications
Bridge Filter Applications Parameters
Bridge Filter Application Parameters
Bridge Ports Display
Configuring Bridge Ports
Bridge Port Record Example
Bridge Port Parameters
16-14
Is the MAC address of the LLC2 host in the node
Page
Configuring Snmp System Defaults
Chapter Configuring Snmp
System Defaults Parameters
Configuring a Community Table
Snmp System Defaults Parameters
Community Table Parameter
Community Table Parameters
Trap Routing Parameters
Configuring Trap Routing
Trap Routing Parameters
Add ress
Page
Section III Operation
Page
For reference, the following figure shows the Main Menu
Introduction to System Operation
Operations On-Line Node Operations Chapter
Assure they were correctly created
Protocol Status
Reports
Page
Chapter On-line Operations
Remote Control
Rebooting the Remote Node
Remote Control from the SmartSwitch
Exiting Remote Control
Remote Control from an Async PAD Port
Remote File Transfer
Transferring Files and Updating Software
Remote Software Update
Local Backup and Restore Items D, E
Remote Backup and Restore Items A-C
Backing Up and Restoring Files
Backing Up and Restoring a Database
Copying the Directory to the PC
Copying a SmartSwitch 1800 Directory to/from a PC
Copying the Directory from the PC
Backing Up and Restoring Local Files
Local File Backup
Database Files
Local File Restore
Disabling and Enabling Ports
Enable/Disable Operations
Quiescing and Unquiescing Ports
On-Line Sdlc PU Operations Menu
Disabling and Enabling Sdlc PUs
IP Ping Connectivity Test
Tests
CSU/DSU Tests
Reloading Auxiliary Console Initialization
Initiating Frame Relay Backup Switchover/Switchback
Displaying Node Status
Chapter Status Displays
SNA = SNA
Displaying Port Status
Status Displays 20-3
Displaying Virtual Connections
Virtual Connections Display on Frame Relay Port
Virtual Connections Display on Non-Frame Relay Port
Port Signals Display
Displaying Port Signals
Serial Ports
Monitoring Traffic
Sdlc Station Address to filter FF=All
X.25 Line Monitor Display
Line Monitor
Port Trace Example
NR 7 NS 7 0204280002000001038000C9C4407E40C9D9D4C17BF4 SNA
Frame Relay Line Monitor Display
Frame Relay Ports
LMI
Lapb Sabm
LLC2 802.5 SRB BAN
01 = RIP Version 1 = must be zero
Monitoring LAN Traffic
Configuring the Monitor
LAN Capture Display
Displaying Capture Data
Displaying Frame Relay Backup Status
10 Sdlc PU Status Display
Displaying Sdlc PU Status
11 Voice Interfaces Display
Displaying Voice Interfaces
Displaying LLC2 Session Status
Bridge Port Status
Bridge Status Displays
All MAC addresses are in non-canonical Token Ring format
Bridge Forwarding Table
13 Bridge Forwarding Table Display
IP Routing Table
IP Status Displays
ARP Table
IP Interfaces
RIP Table
IPX Status Displays
SAP Table
RLP Statistics
Chapter Statistics Displays
RLP Statistics Configuration Menu
Configuring RLP Statistics Thresholds
Port Statistics Display
Port Statistics
Port Statistics Configuration Menu
Configuring Port Statistics Thresholds
Frame-level Statistics Display
Frame-level Statistics
Frame Relay Utilization Statistics Display
Frame Relay Utilization Statistics
Voice Application Statistics
Voice Statistics
STA Tisti CS
Voice Connection Statistics
Bridge Port Status Display
Bridge Port Statistics
Information on the Bridge Port Statistics Display
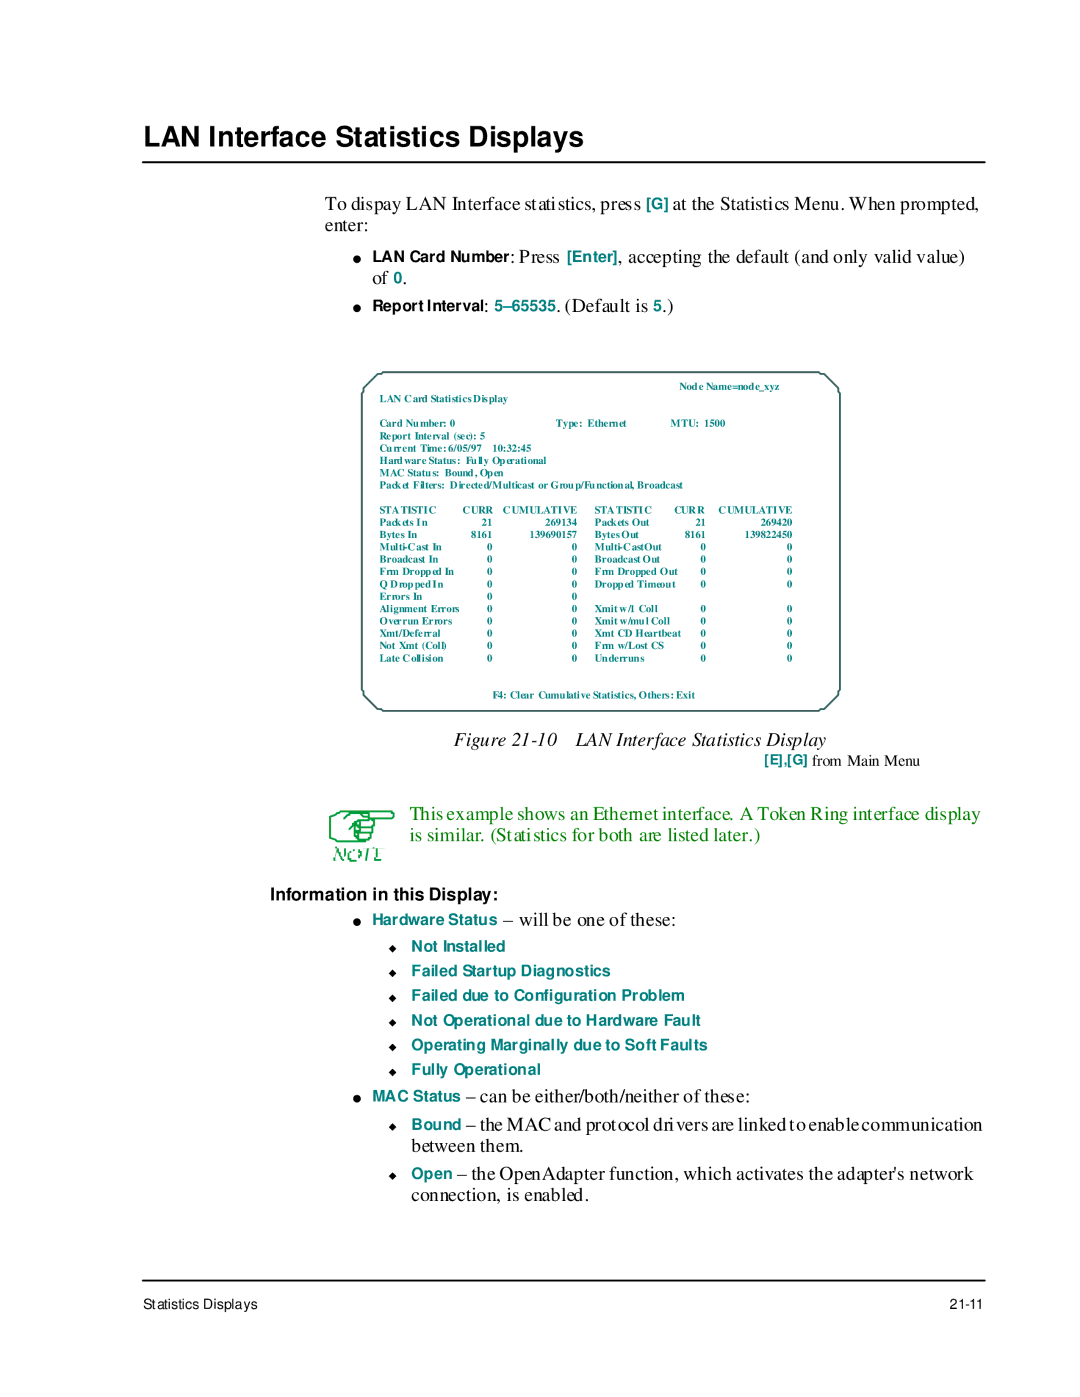
10 LAN Interface Statistics Display
LAN Interface Statistics Displays
Ethernet-Specific Statistics
Token Ring -Specific Statistics
IP Statistics
IP Statistics Displays
12 Icmp Statistics Display
Icmp Statistics
21-16
Statistics Displays 21-17
13 IP Interface Statistics Display
IP Interface Statistics
14 IPX Statistics Display
IPX Statistics Displays
21-20
Statistics Displays 21-21
= NCP Process
Chapter System Events
Configuration
Event Reporting Configuration Example
Alarm Buffer
Displaying Events
Event Generation
Event Messages
Severity Levels for Snmp Trap Routing
Figured as logical DCEs or logical DTEs
RLP statistic Retransmitted Frames/Sec *100 has exceeded
Current value
Rcv Port Usage exceeded Tn Cn
Configuration records to make sure they match the HPAD/TPAD
Meaning Self-explanatory Action None
Severity Meaning The Sdlc PU status has changed Action None
Relay access device SmartSwitch 1800, FRM, FRX4000
Abbreviated Address file has been updated
SVC Subscriber file has been updated
Severity Meaning Login file has been updated Action None
Situation that caused event 305 has ended
Contact Cabletron Systems Technical Support . See page 22
Severity Meaning Self-explanatory
So the node adjusted the bandwidth allocated to this trunk
Invalid. This error disables the port
Correct the line speed in the Port record
Event message is sent and the link goes down
Severity Meaning Self-explanatory Action Create a PVC record
LLC Host File UpdLLC2HPAR.DAT
Or IPX interface
Action Check the PU to make sure it is operational
Or Acknowledgment Timer T2 has expired
Support . See
LLC/2 Frmr Sent, Ifld too long
Page
Section IV Appendices
Page
Appendix a Async Terminal Operations
Command and Data Transfer Modes
Placing a Call from an Async Terminal
Async Terminal Commands
Async PAD Service Signals
SmartSwitch 1800 4 User Guide, Rev
Error Codes Sent to Async PAD Port
Page
Cause Codes
Appendix B Cause and Diagnostic Codes
Clearing Causes
Reset Causes
Diagnostic Codes
Restart Causes
Codes
Cause and Diagnostic Codes
Cabletron-Specific Codes
SNA Codes
Connection rejected transient condition
Page
Voice Port Operation
Appendix C Voice Configuration Reference Information
Store and Forward Dialing
Figure C-1 Store and Forward Dialing Example
Map Table Store and Forward Digits
Figure C-2 Store and Forward Dialing Example
User-Dialed Store and Forward Digits
Forward Delay = 4 .25 sec intervals
Variable-Length Dialing
Figure C-3 Variable-Length Dialing Example
Voice Port 5 Configuration
Using Wildcards in Speed-Dial Numbers
Telephone Interfaces
Telephony Interface
OPX Connections
Connections
SLT Connections
Figure C-6 AC15 Example
AC15 Connections
Table C-1 RJ45 Cable Connections
PTT/Telco Connectors and Cabling
Table C-2 E&M Wiring
Wiring
Figure C-8 E&M Connections
Signaling Types
Type
Figure C-9 E&M Signaling Types
Grounding Considerations
Application Examples
Interface Conversions
Type
Repair Instructions
Telephone Company Rights and Responsibilities
Page
Appendix D NetView Management
Figure D-1 NetView Access Options Menu
Local NetView Access
Display Commands
Supported Commands
Modify Commands
Vary Commands
Corresponding Parameter Keyword SmartSwitch Valid Values
Page
Decimal Octal Hex Ctrl Key Character Value Combination
Appendix E Ascii Character Table
Decimal Octal Hex Character Value Comma
Pipe
Page
Con figuratio n
Appendix F Menu Structure
25 Address Translation Templates
Self Test Pattern Generation Test
Display Voice Statistics
Glossary
Bpdu
See Database
DTE
Configured for FXO by setting the Voice port parameterto OPX
Is the packet layer in the OSI reference model
Is a series of points connected by communications channels
Is the entry or exit point for node traffic
Is the same as Fragmentation
Is a physical or logical link between nodes
Xpad
Page
12-17
Index
SNA
IPX
LAN ID
NRZ
PU Sdlc
SRB ID
17 ,16-4