ARENA / RANGER | USER GUIDE |
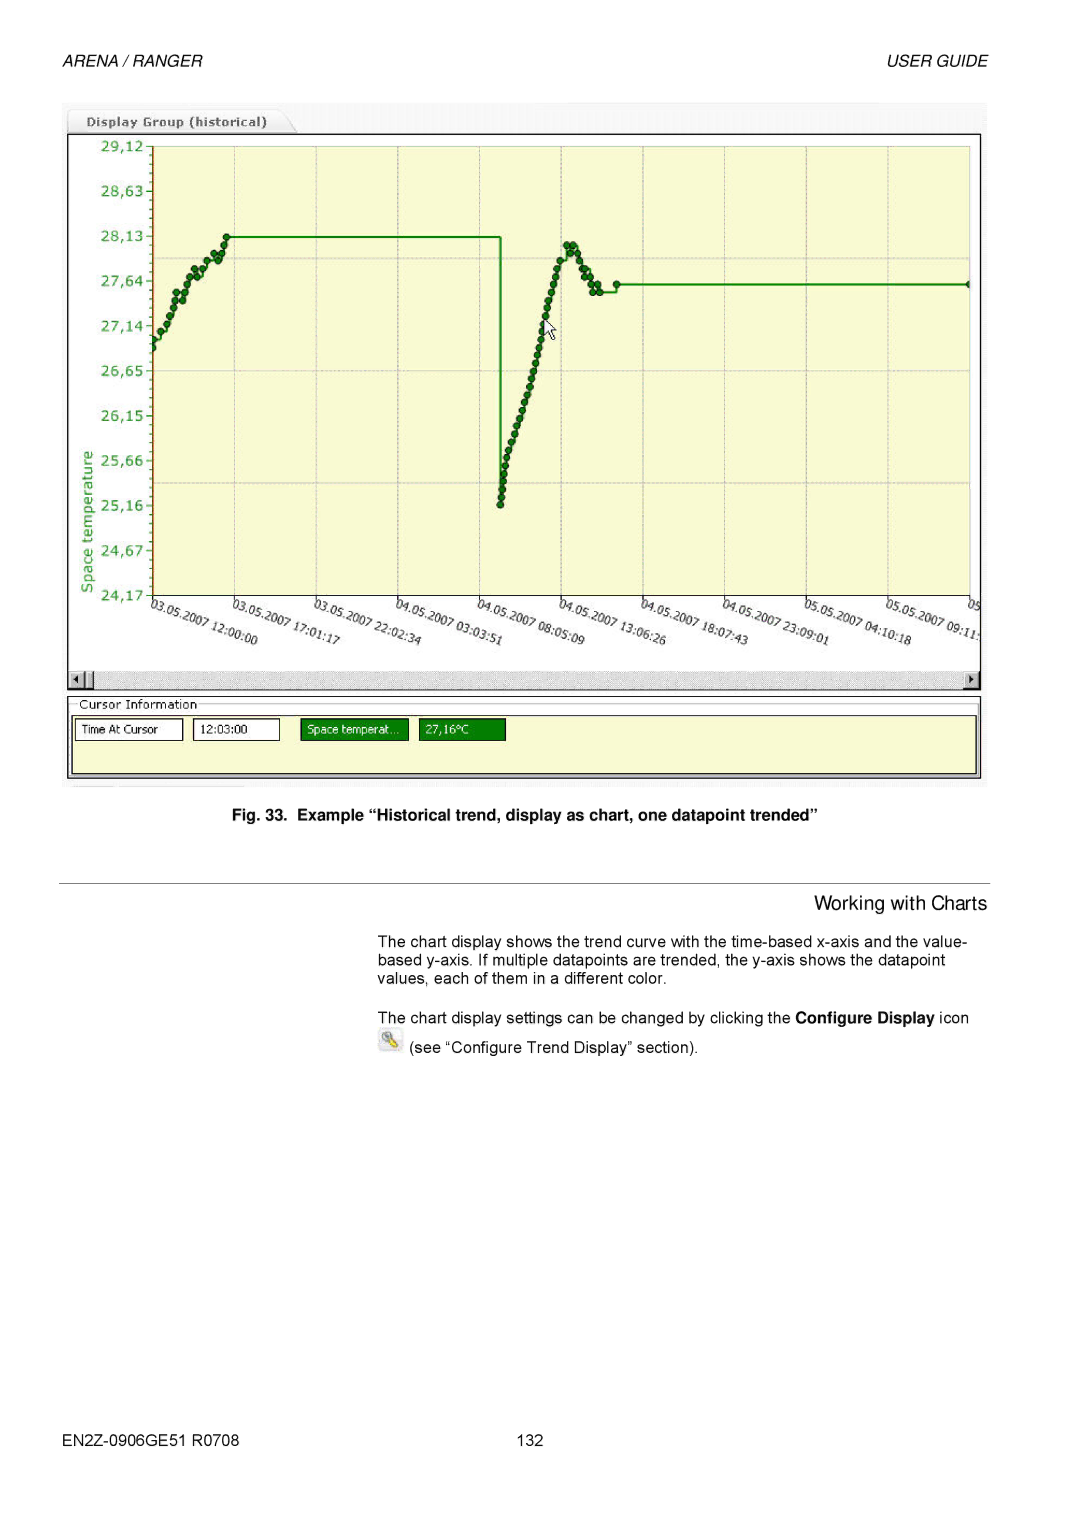
Fig. 33. Example “Historical trend, display as chart, one datapoint trended”
Working with Charts
The chart display shows the trend curve with the
The chart display settings can be changed by clicking the Configure Display icon ![]() (see “Configure Trend Display” section).
(see “Configure Trend Display” section).
132 |