USER GUIDE | ARENA/ RANGER |
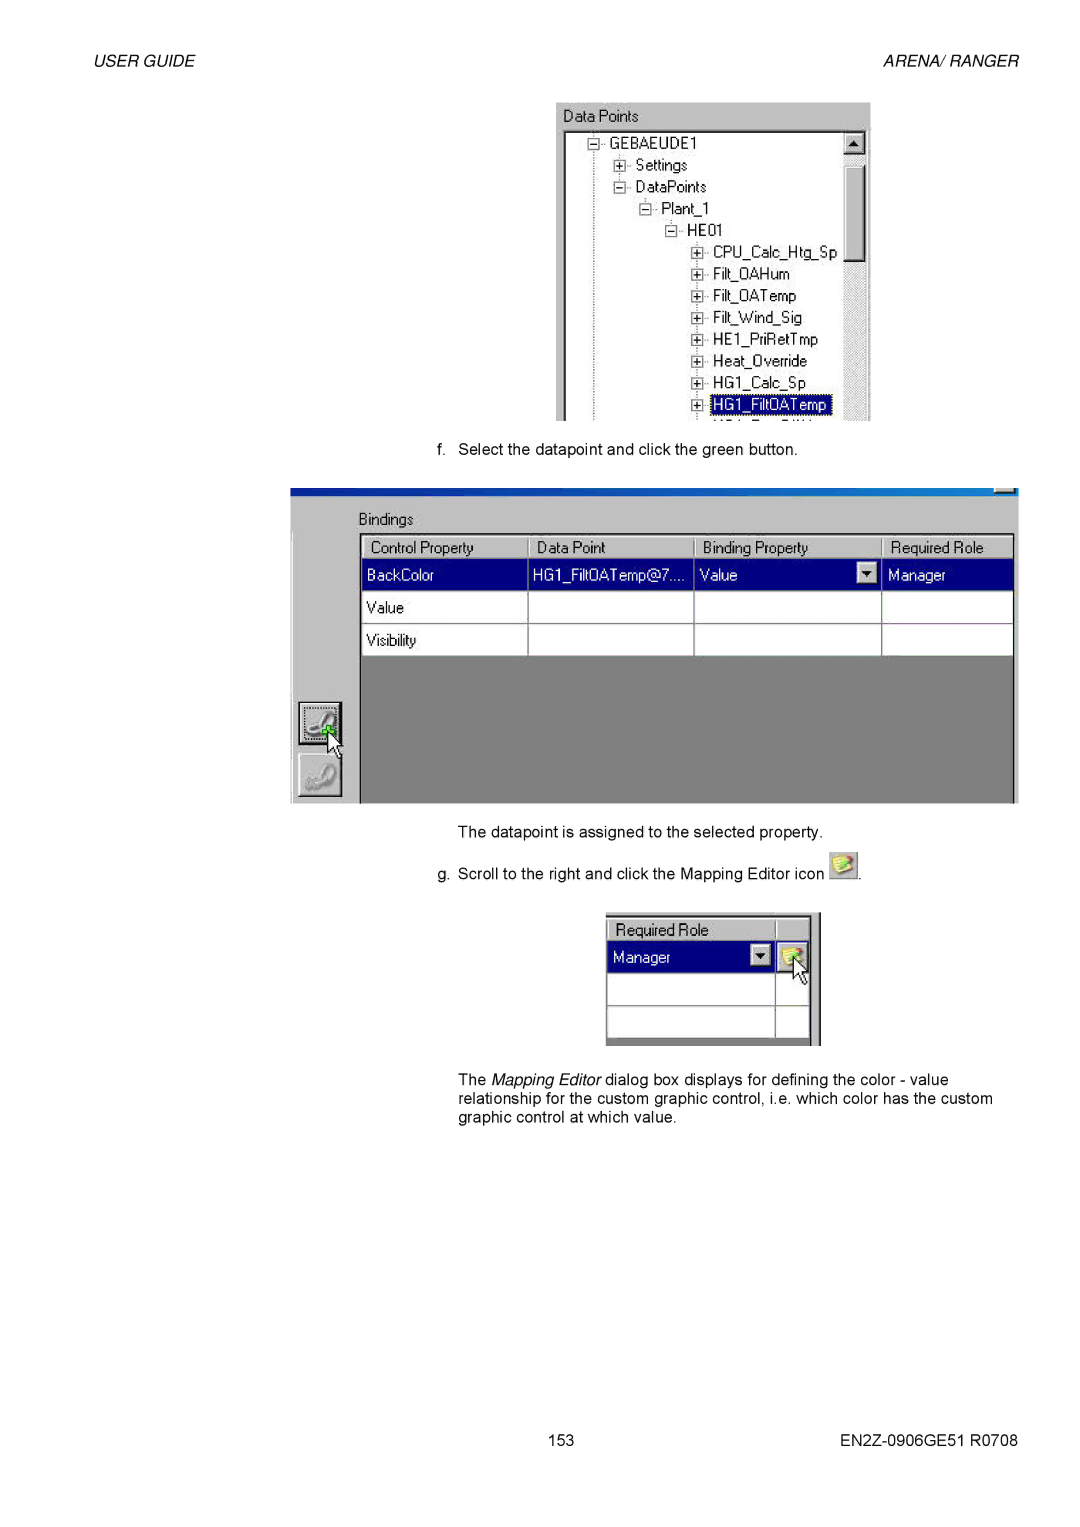
f. Select the datapoint and click the green button.
The datapoint is assigned to the selected property.
g. Scroll to the right and click the Mapping Editor icon ![]() .
.
The Mapping Editor dialog box displays for defining the color - value relationship for the custom graphic control, i.e. which color has the custom graphic control at which value.
153 |
|