ARENA / RANGER | USER GUIDE |
Charting area
Select how the curve is displayed under:
Main chart (common
The curve is shown in the main chart and uses the same
Main chart (separate
The curve is shown in the main chart and uses a separate
Separate chart (stacked)
The curve is shown in a separate chart
Display Group
A display group is the tab on which the curve is displayed on the Trends tab. The checkmark in the second column indicates where the curve is displayed. You can create a new group by clicking the New button and delete a group by clicking the Delete button after you have check the group in the first column
3. Click OK button to save display settings.
Define X-Axis Configuration
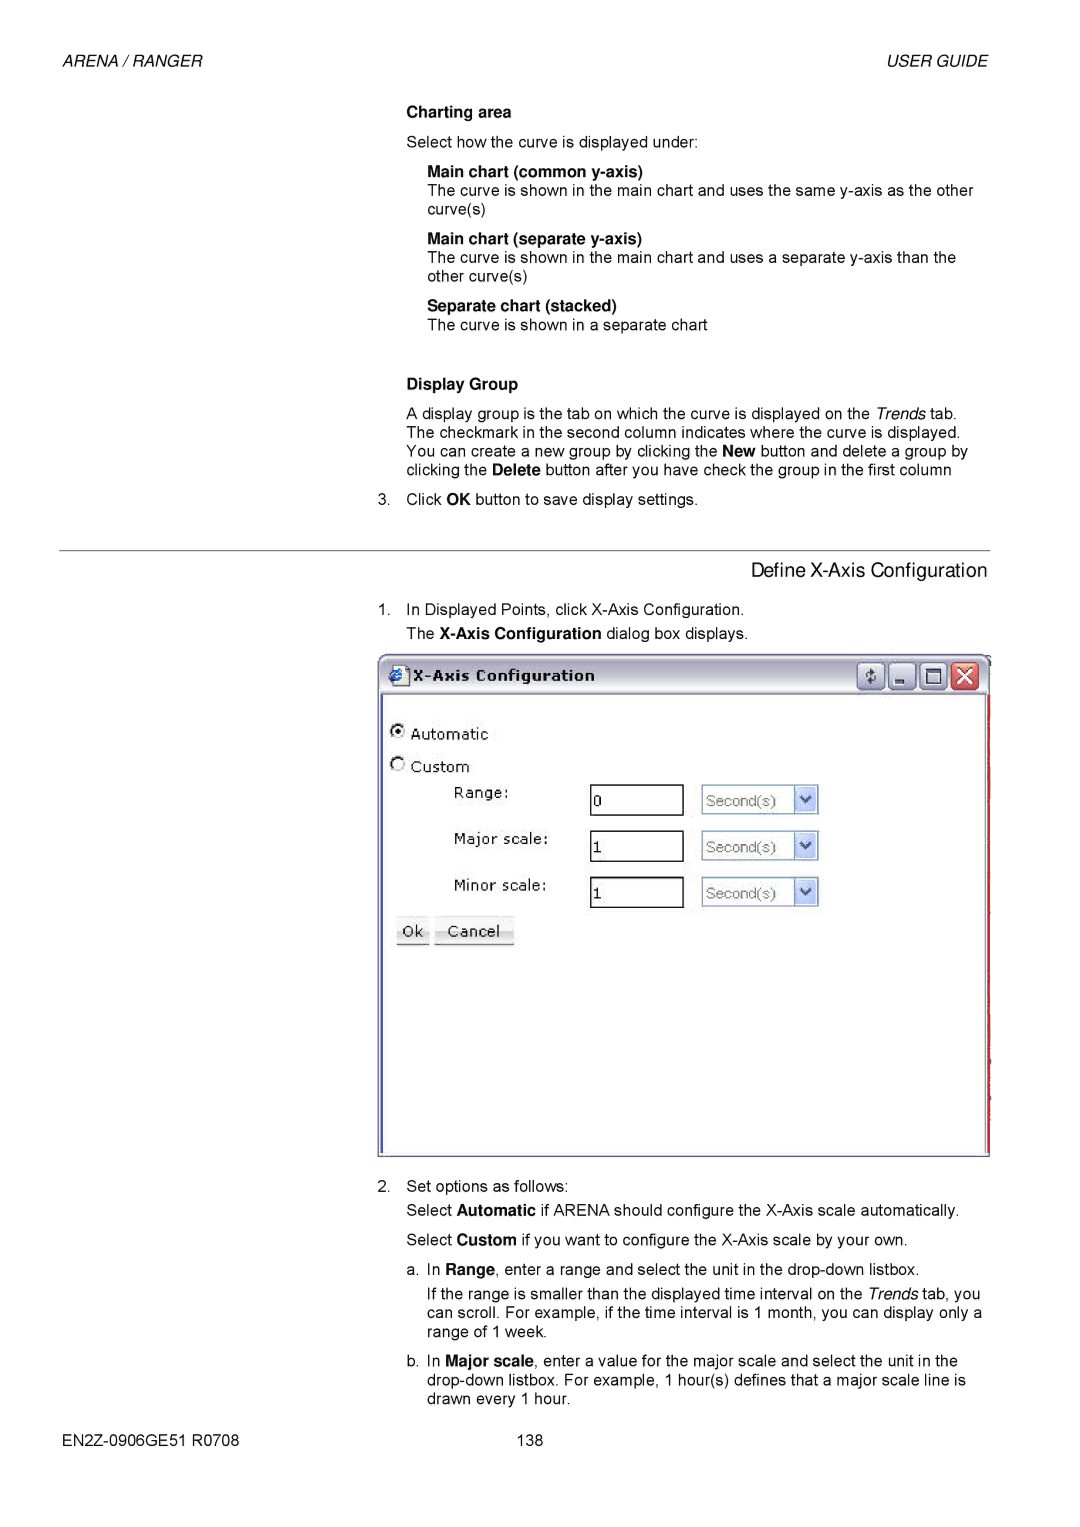
1.In Displayed Points, click
2.Set options as follows:
Select Automatic if ARENA should configure the
a.In Range, enter a range and select the unit in the
If the range is smaller than the displayed time interval on the Trends tab, you can scroll. For example, if the time interval is 1 month, you can display only a range of 1 week.
b.In Major scale, enter a value for the major scale and select the unit in the
138 |