ARENA / RANGER | USER GUIDE |
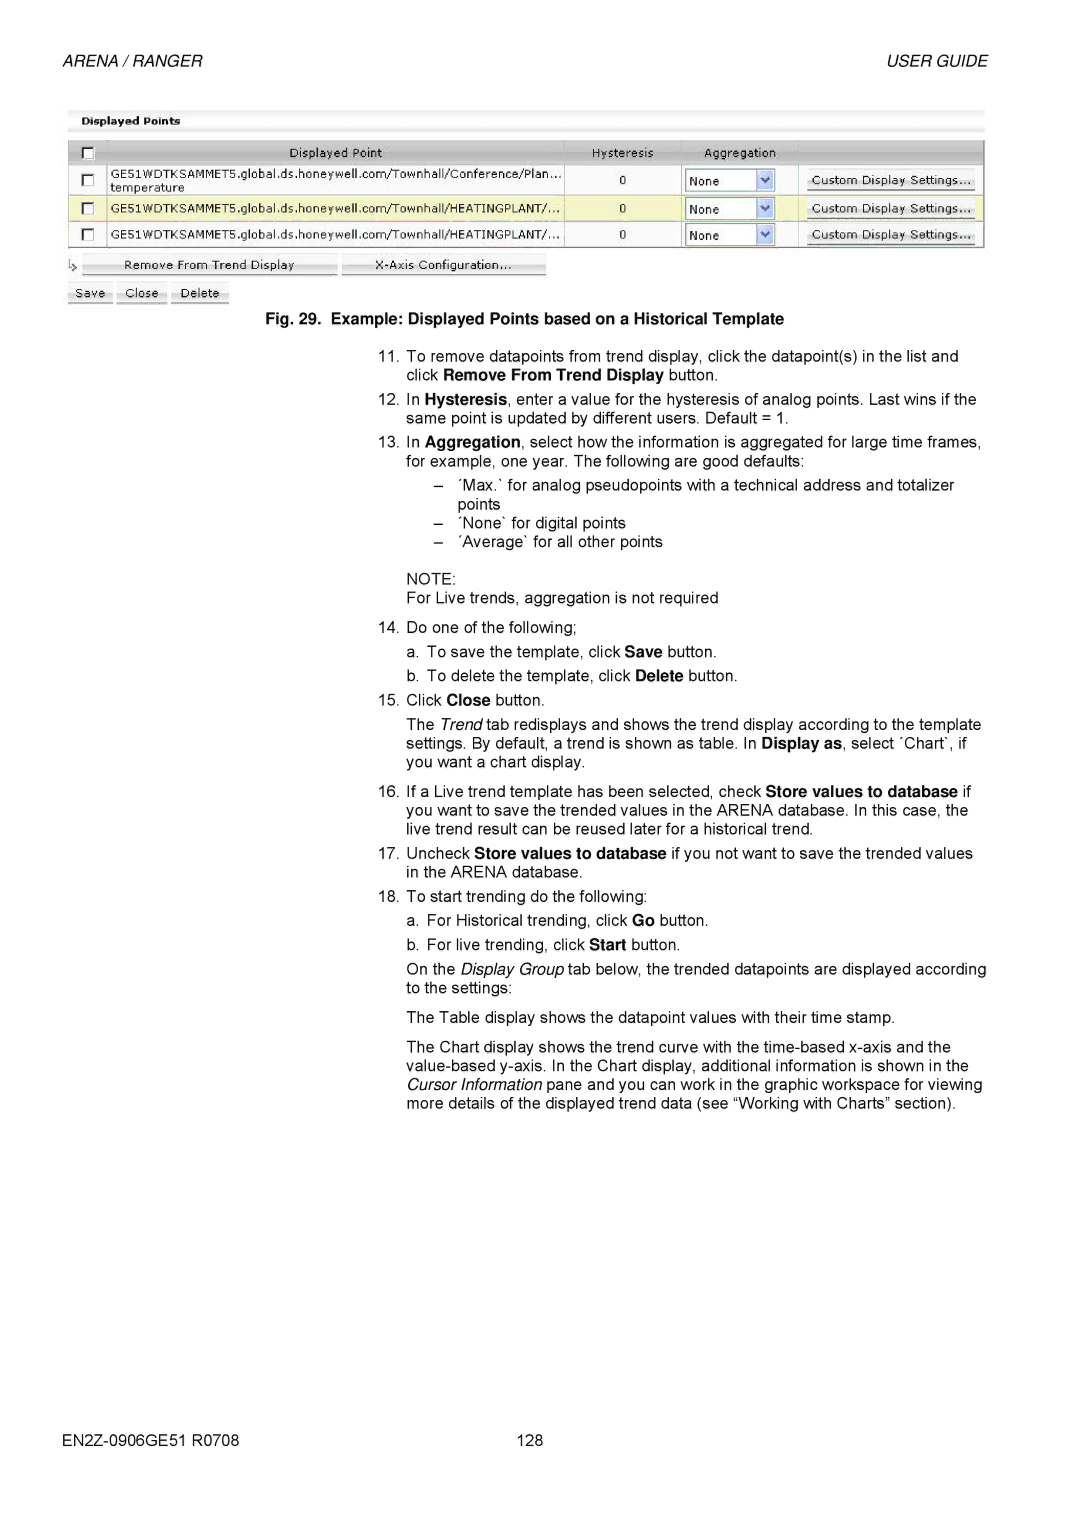
Fig. 29. Example: Displayed Points based on a Historical Template
11.To remove datapoints from trend display, click the datapoint(s) in the list and click Remove From Trend Display button.
12.In Hysteresis, enter a value for the hysteresis of analog points. Last wins if the same point is updated by different users. Default = 1.
13.In Aggregation, select how the information is aggregated for large time frames, for example, one year. The following are good defaults:
–´Max.` for analog pseudopoints with a technical address and totalizer points
–´None` for digital points
–´Average` for all other points
NOTE:
For Live trends, aggregation is not required
14.Do one of the following;
a.To save the template, click Save button.
b.To delete the template, click Delete button.
15.Click Close button.
The Trend tab redisplays and shows the trend display according to the template settings. By default, a trend is shown as table. In Display as, select ´Chart`, if you want a chart display.
16.If a Live trend template has been selected, check Store values to database if you want to save the trended values in the ARENA database. In this case, the live trend result can be reused later for a historical trend.
17.Uncheck Store values to database if you not want to save the trended values in the ARENA database.
18.To start trending do the following:
a.For Historical trending, click Go button.
b.For live trending, click Start button.
On the Display Group tab below, the trended datapoints are displayed according to the settings:
The Table display shows the datapoint values with their time stamp.
The Chart display shows the trend curve with the
128 |
