![]() 4
4
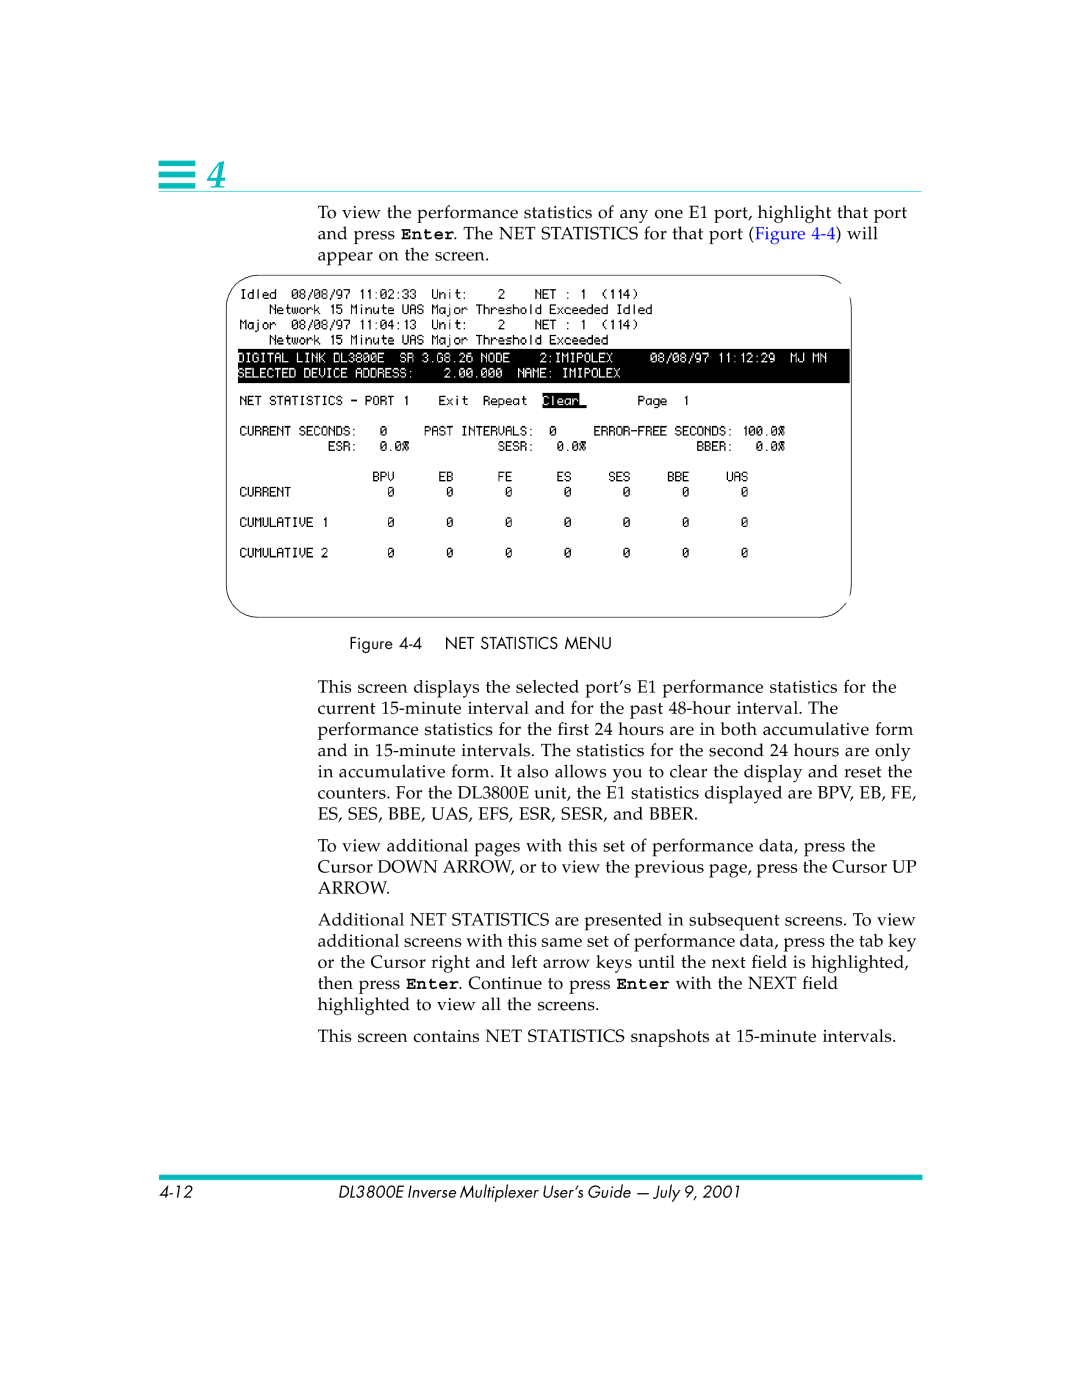
To view the performance statistics of any one E1 port, highlight that port and press Enter. The NET STATISTICS for that port (Figure
Figure 4-4 NET STATISTICS MENU
This screen displays the selected port’s E1 performance statistics for the current
To view additional pages with this set of performance data, press the Cursor DOWN ARROW, or to view the previous page, press the Cursor UP ARROW.
Additional NET STATISTICS are presented in subsequent screens. To view additional screens with this same set of performance data, press the tab key or the Cursor right and left arrow keys until the next field is highlighted, then press Enter. Continue to press Enter with the NEXT field highlighted to view all the screens.
This screen contains NET STATISTICS snapshots at
DL3800E Inverse Multiplexer User’s Guide — July 9, 2001 |