|
| Installation and Operation Manual | Chapter 6 Troubleshooting and Diagnostics |
|
| ||
|
|
|
|
|
|
| |
|
|
|
|
|
|
| |
|
|
|
|
|
|
| |
|
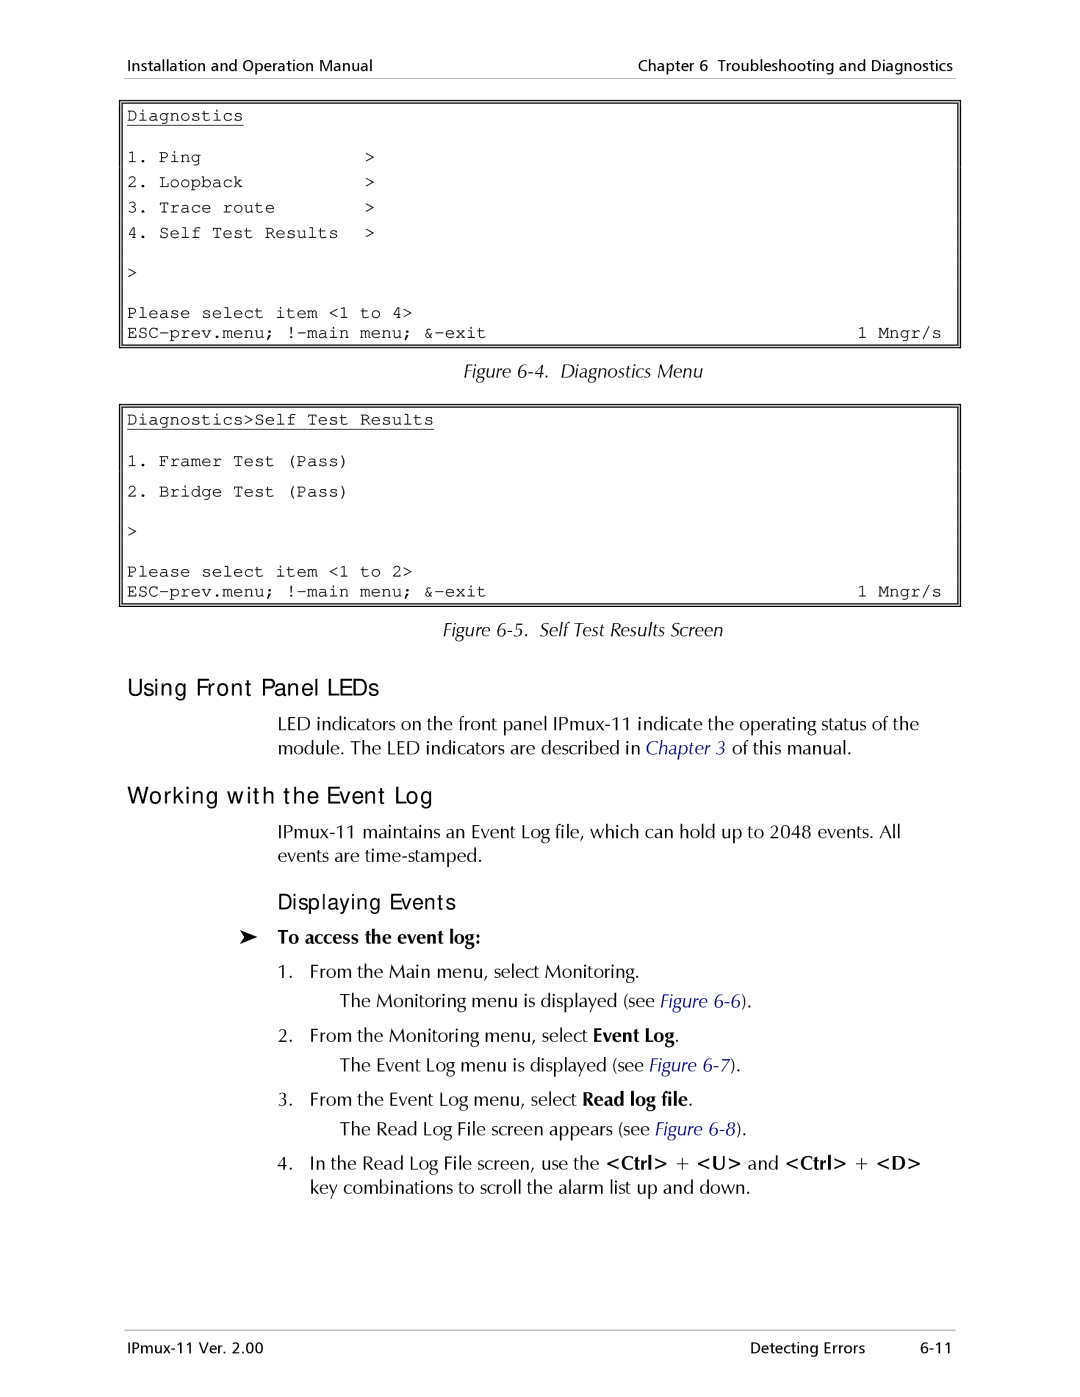
| Diagnostics |
|
|
|
| |
|
| 1. | Ping | > |
|
|
|
|
| 2. | Loopback | > |
|
|
|
|
| 3. | Trace route | > |
|
|
|
|
| 4. | Self Test Results | > |
|
|
|
> |
|
Please select item <1 to 4> | 1 Mngr/s |
|
|
Figure |
|
|
|
Diagnostics>Self Test Results |
|
1. Framer Test (Pass) |
|
2. Bridge Test (Pass) |
|
> |
|
Please select item <1 to 2> | 1 Mngr/s |
|
|
Figure 6-5. Self Test Results Screen
Using Front Panel LEDs
LED indicators on the front panel
Working with the Event Log
Displaying Events
To access the event log:
1. From the Main menu, select Monitoring.
The Monitoring menu is displayed (see Figure
The Event Log menu is displayed (see Figure
The Read Log File screen appears (see Figure
4.In the Read Log File screen, use the <Ctrl> + <U> and <Ctrl> + <D> key combinations to scroll the alarm list up and down.
Detecting Errors |