Installation and Operation Manual | Chapter 6 Troubleshooting and Diagnostics |
|
|
Displaying Bundle Connection Statistics
The Connection screen provides information about the integrity of the TDMoIP connection, including the jitter buffer statistics. (Each bundle has it own independent jitter buffer).
To display the bundle connection information:
1.From the Monitoring menu, select Statistics. The Statistics menu appears.
2.From the Statistics menu, select Connection.
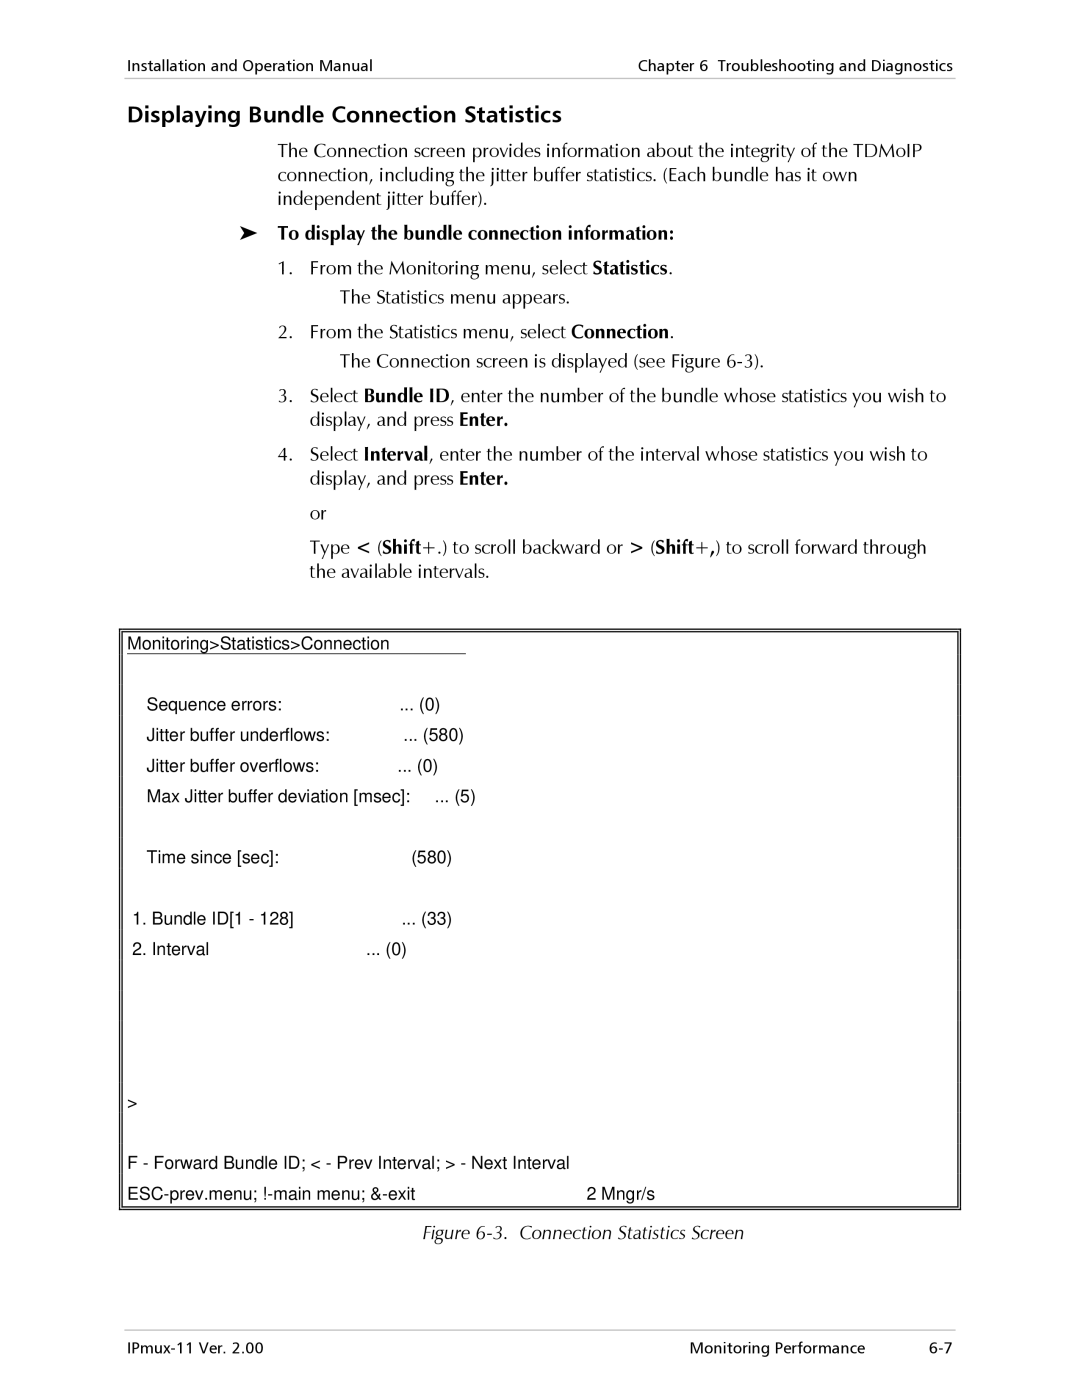
The Connection screen is displayed (see Figure
3.Select Bundle ID, enter the number of the bundle whose statistics you wish to display, and press Enter.
4.Select Interval, enter the number of the interval whose statistics you wish to display, and press Enter.
or
Type < (Shift+.) to scroll backward or > (Shift+,) to scroll forward through the available intervals.
Monitoring>Statistics>Connection |
| |
| Sequence errors: | ... (0) |
| Jitter buffer underflows: | ... (580) |
| Jitter buffer overflows: | ... (0) |
| Max Jitter buffer deviation [msec]: | ... (5) |
| Time since [sec]: | (580) |
1. | Bundle ID[1 - 128] | ... (33) |
2. | Interval | ... (0) |
> |
|
F - Forward Bundle ID; < - Prev Interval; > - Next Interval |
|
2 Mngr/s |
Figure 6-3. Connection Statistics Screen
Monitoring Performance |