Chapter 6 Troubleshooting and Diagnostics | Installation and Operation Manual |
|
|
To view the E1/T1 statistics:
1.From the Monitoring menu (Figure
2.From the Statistics menu, select Physical Layer.
The Physical Layer (E1) or Physical Layer (T1) screen appears (see Figure
3.Select Interval, enter the number of the interval whose statistics you wish to display, and press Enter
or
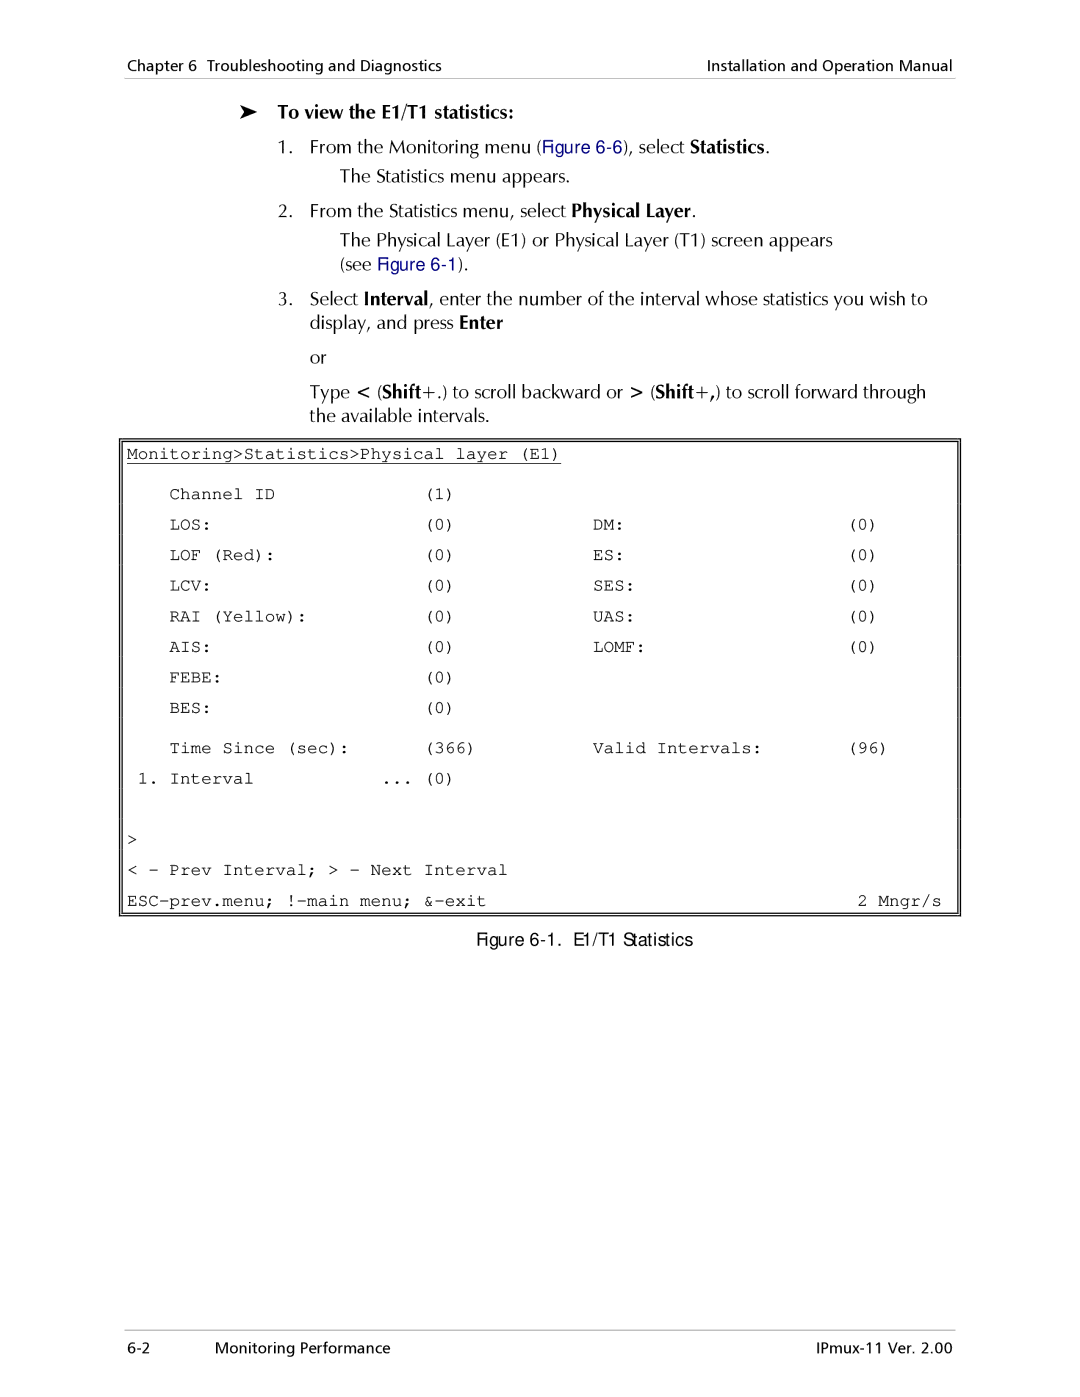
Type < (Shift+.) to scroll backward or > (Shift+,) to scroll forward through the available intervals.
Monitoring>Statistics>Physical layer (E1)
Channel ID | (1) |
|
|
LOS: | (0) | DM: | (0) |
LOF (Red): | (0) | ES: | (0) |
LCV: | (0) | SES: | (0) |
RAI (Yellow): | (0) | UAS: | (0) |
AIS: | (0) | LOMF: | (0) |
FEBE: | (0) |
|
|
BES: | (0) |
|
|
Time Since (sec): | (366) | Valid Intervals: | (96) |
1. Interval | ... (0) |
|
|
> |
|
| |
| < - Prev Interval; > - Next Interval |
|
|
| 2 Mngr/s | ||
|
|
|
|
| Figure | E1/T1 Statistics | |
Monitoring Performance |