|
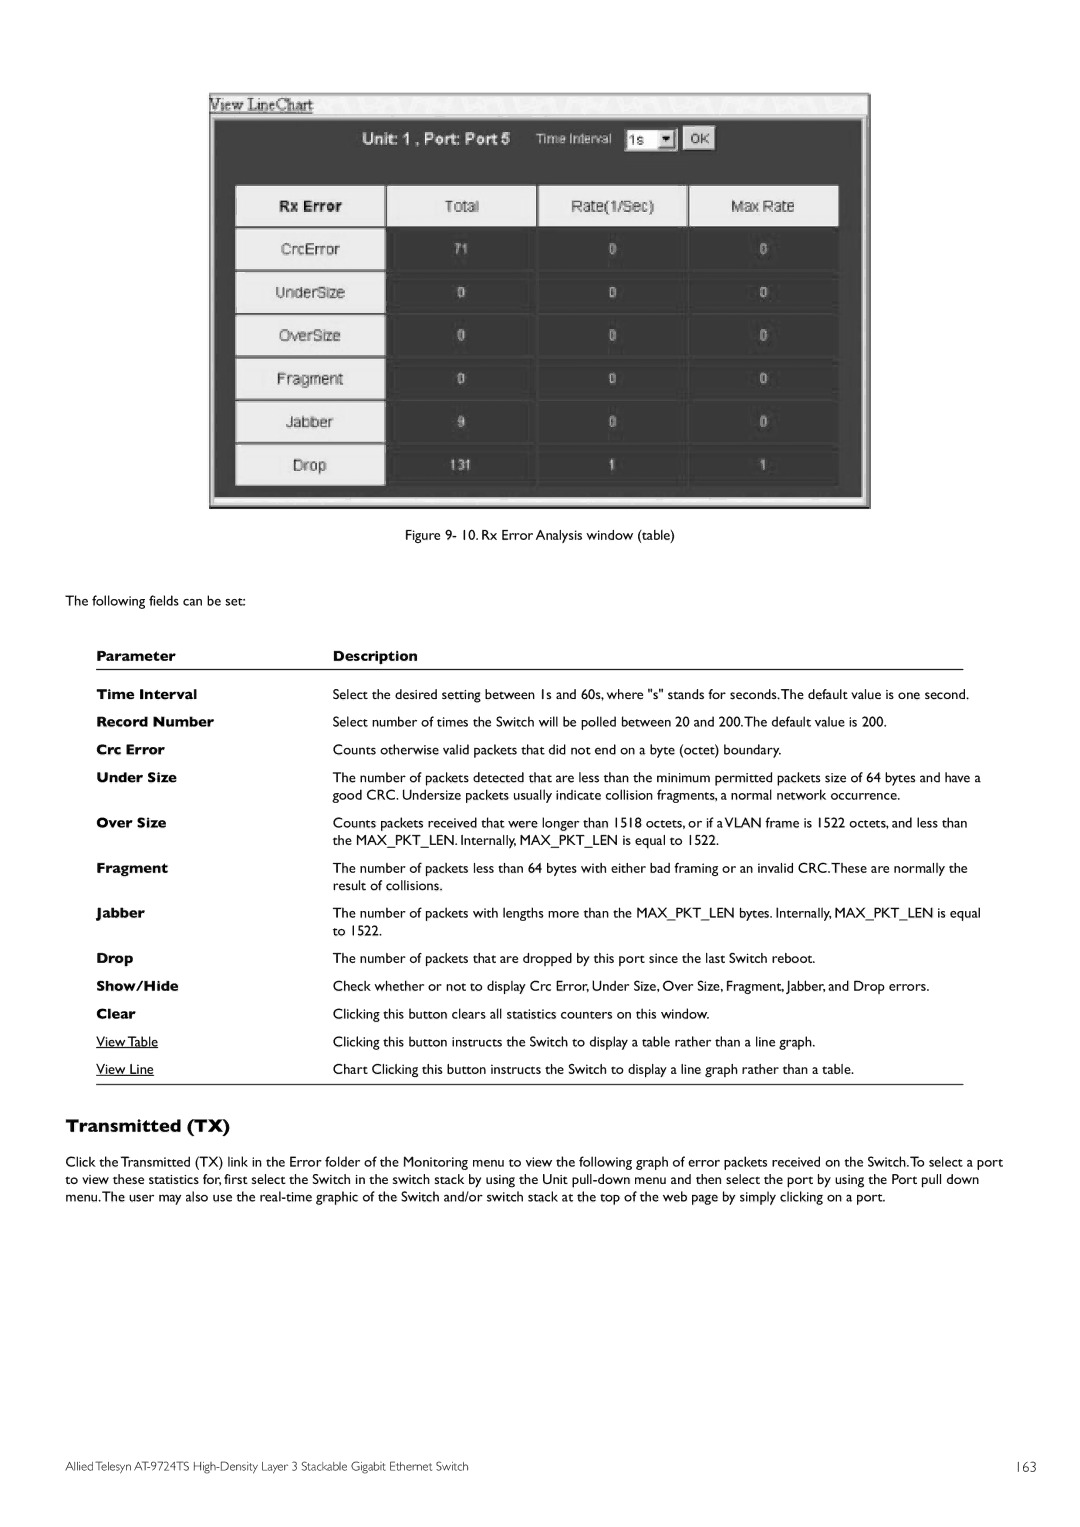
| Figure 9- 10. Rx Error Analysis window (table) | |
The following fields can be set: |
|
| |
| Parameter | Description |
|
| Time Interval | Select the desired setting between 1s and 60s, where "s" stands for seconds.The default value is one second. | |
| Record Number | Select number of times the Switch will be polled between 20 and 200.The default value is 200. | |
| Crc Error | Counts otherwise valid packets that did not end on a byte (octet) boundary. | |
| Under Size | The number of packets detected that are less than the minimum permitted packets size of 64 bytes and have a | |
| Over Size | good CRC. Undersize packets usually indicate collision fragments, a normal network occurrence. | |
| Counts packets received that were longer than 1518 octets, or if a VLAN frame is 1522 octets, and less than | ||
| Fragment | the MAX_PKT_LEN. Internally, MAX_PKT_LEN is equal to 1522. | |
| The number of packets less than 64 bytes with either bad framing or an invalid CRC.These are normally the | ||
| Jabber | result of collisions. | |
| The number of packets with lengths more than the MAX_PKT_LEN bytes. Internally, MAX_PKT_LEN is equal | ||
| Drop | to 1522. | |
| The number of packets that are dropped by this port since the last Switch reboot. | ||
| Show/Hide | Check whether or not to display Crc Error, Under Size, Over Size, Fragment, Jabber, and Drop errors. | |
| Clear | Clicking this button clears all statistics counters on this window. | |
| View Table | Clicking this button instructs the Switch to display a table rather than a line graph. | |
| View Line | Chart Clicking this button instructs the Switch to display a line graph rather than a table. |
|
Transmitted (TX)
Click the Transmitted (TX) link in the Error folder of the Monitoring menu to view the following graph of error packets received on the Switch.To select a port to view these statistics for, first select the Switch in the switch stack by using the Unit
Allied Telesyn | 163 |