Chapter 9 - Monitoring
9-1 Port Utilization
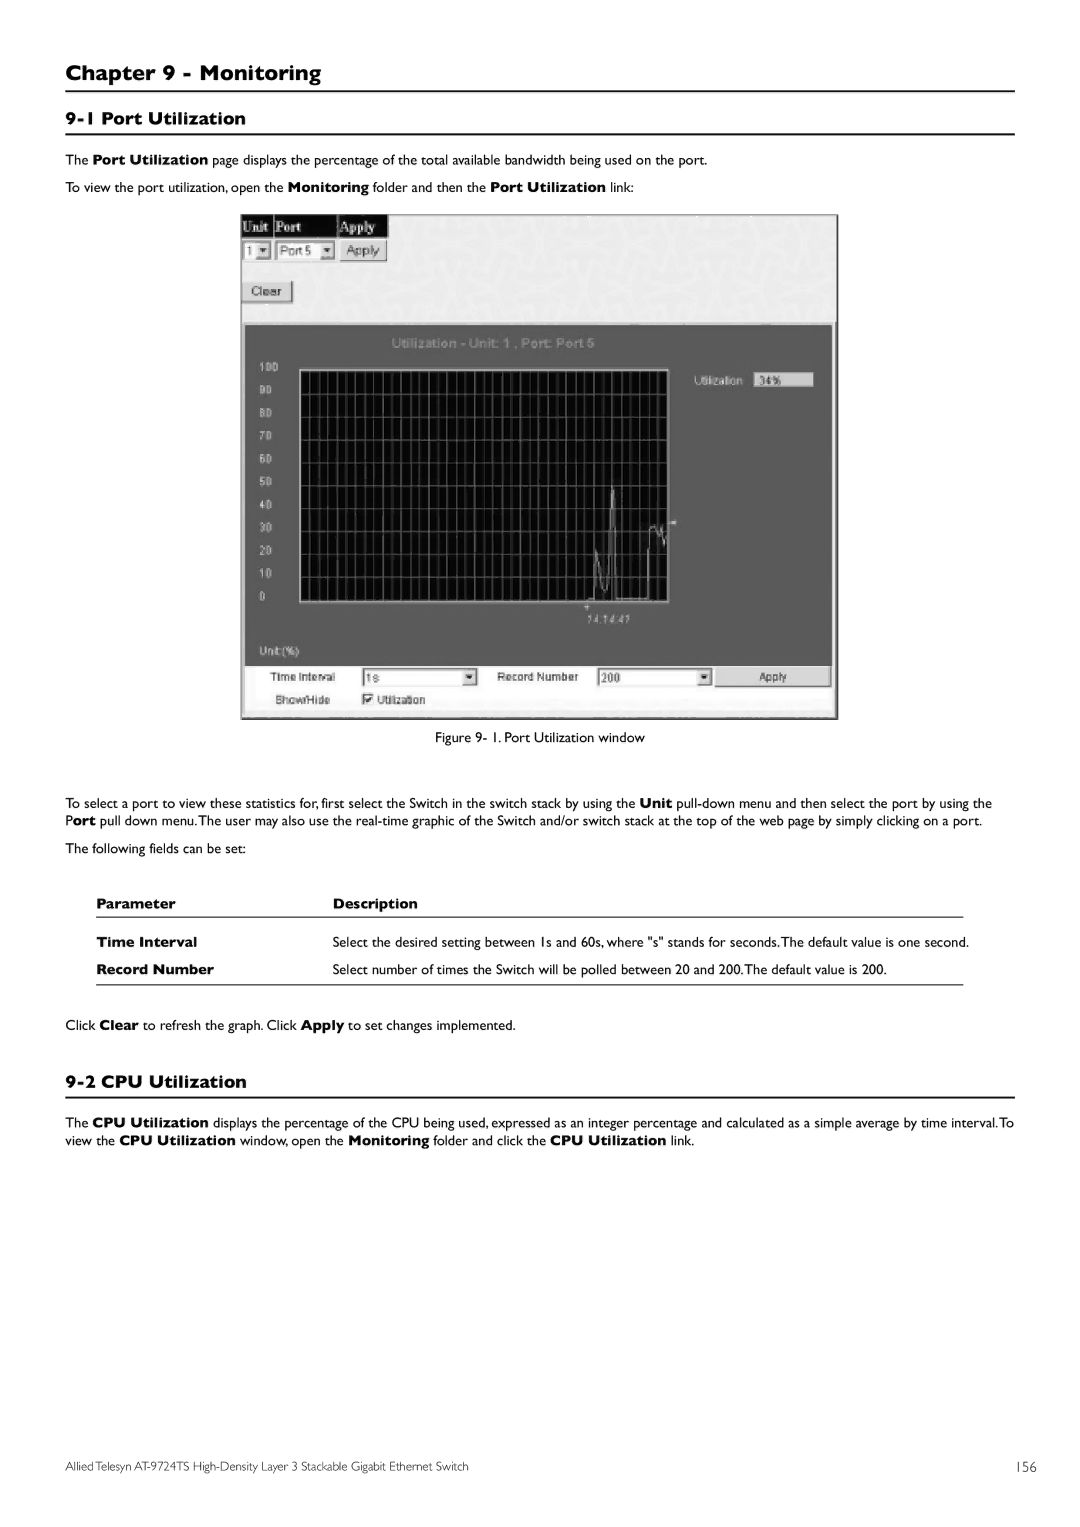
The Port Utilization page displays the percentage of the total available bandwidth being used on the port.
To view the port utilization, open the Monitoring folder and then the Port Utilization link:
Figure 9- 1. Port Utilization window
To select a port to view these statistics for, first select the Switch in the switch stack by using the Unit pull-down menu and then select the port by using the Port pull down menu.The user may also use the real-time graphic of the Switch and/or switch stack at the top of the web page by simply clicking on a port. The following fields can be set:
Parameter | Description |
|
Time Interval | Select the desired setting between 1s and 60s, where "s" stands for seconds.The default value is one second. | |
Record Number | Select number of times the Switch will be polled between 20 and 200.The default value is 200. |
|
Click Clear to refresh the graph. Click Apply to set changes implemented.
9-2 CPU Utilization
The CPU Utilization displays the percentage of the CPU being used, expressed as an integer percentage and calculated as a simple average by time interval.To view the CPU Utilization window, open the Monitoring folder and click the CPU Utilization link.
Allied Telesyn | 156 |
