Debugger Components
Component Introduction
62
Microcontrollers Debugger Manual
Connection Components
Different debugger connections are available. For example, you can set a CPU awareness
to simulate your .ABS application files, and also set a background debugger.
Different connections are available to connect the target system (hardware) to the
debugger. For example, the connection may be connected using a Full Chip Simulator, an
Emulator, a ROM monitor, a BDM pod cable, or any other supported device.
NOTE Connection components are introduced in their respective manuals.
Loading Component Windows
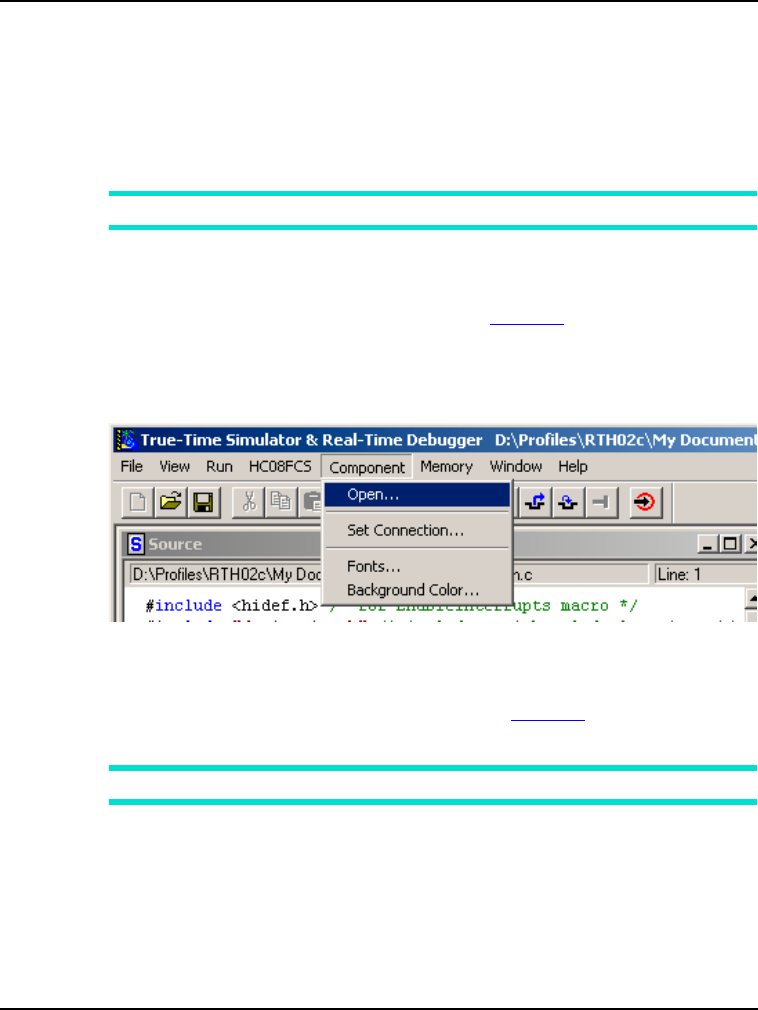
In the Debugger Main Window Menu Bar, shown in Figure 3.1, you can use the
Component menu to load all framework components. Each Debugger component you
select appears as a window in the Debugger main window.
Figure 3.1 Debugger Window Menu Bar
To open the window that lets you choose one or more components:
1. Choose Component > Open
2. In the Open Window Component window shown in Figure 3.2, select the desired
component.
NOTE To open more than one component, select multiple components.