Nortel Wlan Security Switch 2300 Series Configuration Guide
Copyright Nortel Networks Limited 2005. All rights reserved
Trademarks
Restricted rights legend
Statement of conditions
USA requirements only
Nortel Inc. software license agreement
Limited Product Warranty
Legal Information
Limited Warranty
Software License Agreement
Nortel Wlan Security Switch 2300 Series Configuration Guide
SSH Source Code Statement
OpenSSL Project License Statements
Class a Statement RF Radiation Hazard Warning
Deployment Statement
320657-A
Contents
Configuring and Managing Ports and VLANs
Configuring and Managing IP Interfaces and Services
Configuring Snmp
Configuring and Managing Mobility Domain Roaming
Configuring AP access points
Wi-Fi Multimedia
Configuring and Managing Igmp Snooping
Managing Keys and Certificates
Configuring AAA for Network Users
Configuring Communication with Radius
Managing 802.1X on the WSS Switch
Managing System Files
Troubleshooting a WS Switch
Supported Radius Attributes
Contents 320657-A
Getting Help from the Nortel Web site
How to get Help
Getting Help over the phone from a Nortel Solutions Center
Getting Help through a Nortel distributor or reseller
Introducing the Nortel Wlan 2300 System
Nortel Wlan 2300 System
Planning, Configuration, and Deployment
Documentation
Safety and Advisory Notices
Bold text
Menu Name Command
Text and Syntax Conventions
Using the Command-Line Interface
CLI Conventions
Command Prompts
NT-mm-nnnnnn
Set port enable disable port-list
Syntax Notation
Clear interface vlan-idip
Clear fdb dynamic port port-list vlan vlan-id
IP Address and Mask Notation
Text Entry Conventions and Allowed Characters
MAC Address Notation
User Wildcards, MAC Address Wildcards, and Vlan Wildcards
User Wildcards
MAC Address Wildcards
0001
000102 00010203 0001020304
Vlan Wildcards
Matching Order for Wildcards
23x0# set port enable
23x0# reset port
Port Lists
23x0# show port poe 1,2,4,13
Virtual LAN Identification
Command-Line Editing
Keyboard Shortcuts
Keyboard Shortcuts Function
History Buffer
Tabs
Single-Asterisk * Wildcard Character
Double-Asterisk ** Wildcard Characters
23x0# show i?
Using CLI Help
23x0# help Commands
Understanding Command Descriptions
Server Status Port Enabled
23x0# show ip telnet
Set ap dap name
Configuring AAA for Administrative and Local Access
Overview of AAA for Administrative and Local Access
Configuring AAA for Administrative and Local Access
Before You Start
Typical Nortel Wlan 2300 System
About Administrative Access
Access Modes
First-Time Configuration using the Console
Types of Administrative Access
Enabling an Administrator
Password
23x0 enable
Username
Setting the WSS Switch Enable Password
Setting the WSS Enable Password for the First Time
WMS Enable Password
23x0# set enablepass
Configuring AAA for Administrative and Local Access
Authenticating at the Console
23x0# set authentication console * local
Customizing AAA with Wildcards and Groups
Setting User Passwords
Configuring Accounting for Administrative Users
Adding and Clearing Local Users for Administrative Access
Set user username password password
Success User Jose created
23x0# show accounting statistics
Displaying the AAA Configuration
Saving the Configuration
23x0# save config configday
23x0# show aaa
Administrative AAA Configuration Scenarios
Local Authentication
Success change accepted
23x0# set server group sg1 members r1
Local Override and Backup Local Authentication
Authentication When Radius Servers Do Not Respond
Configuring and Managing Ports and VLANs
Configuring and Managing Ports
Setting the Port Type
Vlan
WSS 2380 40 AP Software License Upgrade
Show version
Setting a Port for a Directly Connected AP access port
23x0# set port type ap 4-6 model 2330 poe enable
Configuring for a Distributed AP
Setting a Port for a Wired Authentication User
Clear port type port-list
23x0# set port type wired-auth
Clearing a Port
Clear dap dap-num
Clearing a Distributed AP
23x0# clear port type
Removing a Port Name
Configuring a Port Name
Setting a Port Name
Set port preference port-listrj45
Clear port preference port-list
Show port preference port-list
RJ45
Gigabit Ports-Autonegotiation and Flow Control
Configuring Port Operating Parameters
10/100 Ports-Autonegotiation and Port Speed
Disabling or Reenabling Power over Ethernet
Disabling or Reenabling a Port
Reset port port-list
Resetting a Port
Set port poe port-listenable disable
Displaying Port Configuration and Status
Displaying Port Information
Displaying PoE State
Show port status port-list
Monitoring Port Statistics
Displaying Port Statistics
Clearing Statistics Counters
23x0# monitor port counters
Configuring Load-Sharing Port Groups
Configuring a Port Group
Load Sharing
Link Redundancy
Configuring and Managing VLANs
Removing a Port Group
Displaying Port Group Information
Interoperating with Cisco Systems EtherChannel
Users and VLANs
Understanding VLANs in Nortel WSS Software
VLANs, IP Subnets, and IP Addressing
Traffic Forwarding
Vlan Names
Roaming and VLANs
802.1Q Tagging
Tunnel Affinity
Configuring a Vlan
Creating a Vlan
Adding Ports to a Vlan
Set vlan vlan-numname name
Removing an Entire Vlan or a Vlan Port
23x0# set vlan red port 9-11,21
23x0# clear vlan red port
23x0# clear vlan marigold port 13 tag
23x0# clear vlan ecru
Changing Tunneling Affinity
Set vlan vlan-idtunnel-affinity num
Show vlan config vlan-id
23x0# show vlan config burgundy
Managing the Layer 2 Forwarding Database
Displaying Vlan Information
Types of Forwarding Database Entries
How Entries Enter the Forwarding Database
Displaying Forwarding Database Information
Displaying the Size of the Forwarding Database
Displaying Forwarding Database Entries
Show fdb count perm static dynamic vlan vlan-id
23x0# set fdb perm 00bbccddeeff port 3,5 vlan blue
23x0# set fdb static 002b3c4d5e6f port 1 vlan default
Adding an Entry to the Forwarding Database
23x0# clear fdb port 3,5
Removing Entries from the Forwarding Database
23x0# clear fdb dynamic
Port and Vlan Configuration Scenario
Configuring the Aging Timeout Period
Displaying the Aging Timeout Period
Changing the Aging Timeout Period
23x0# set port 6 name confroom1
23x0# set port 7 name confroom2
23x0# set port 8-13 name manufacturing
23x0# set system countrycode US
23x0# set port type ap 2-16 model 2330 poe enable
MAC
23x0# set port type wired-auth 17,18
Port group backbonelink is up Ports 22
Save the configuration. Type the following command
Configuring and Managing IP Interfaces and Services
MTU Support
Configuring and Managing IP Interfaces
Enabling the Dhcp Client
Statically Configuring an IP Interface
Adding an IP Interface
23x0# show interface
Set interface vlan-idip dhcp-client enable disable
23x0# set interface corpvlan ip dhcp-client enable
Interface Corpvlan4 Configuration Status Enabled Dhcp State
23x0# show dhcp-client
Disabling or Reenabling an IP Interface
Set interface vlan-idstatus up down
Removing an IP Interface
Show interface vlan-id
Configuring the System IP Address
Displaying IP Interface Information
Designating the System IP Address
Set system ip-address ip-addr
Displaying the System IP Address
Show system
Clear system ip-address
Configuring and Managing IP Routes
Clearing the System IP Address
Configuring and Managing IP Interfaces and Services 320657-A
23x0# show ip route
Displaying IP Routes
Show ip route destination
224.0.0.0/ 4 IP Local
23x0# set ip route 192.168.4.0 255.255.255.0 10.5.4.2
23x0# set ip route default 10.5.4.1
Adding a Static Route
Managing the Management Services
23x0# clear ip route default
Removing a Static Route
23x0# clear ip route 192.168.4.69/24
Login Timeouts
Session Timeouts
Managing SSH
Enabling SSH
Changing the SSH Service Port Number
Adding an SSH User
Show crypto key ssh
23x0# show crypto key ssh ec6f567fd1fdc02893aea4f97cf51304
Changing SSH Timeouts
Show sessions admin Clear sessions admin ssh session-id
23x0# show sessions admin
23x0# clear sessions admin ssh
Telnet Login Timers
Managing Telnet
Enabling Telnet
Adding a Telnet User
Managing Telnet Server Sessions
Changing the Telnet Service Port Number
Resetting the Telnet Service Port Number to Its Default
Configuring and Managing DNS
Managing Https
Enabling Https
Displaying Https Information
Configuring and Managing IP Interfaces and Services
Set ip dns enable disable
Enabling or Disabling the DNS Client
Configuring DNS Servers
Adding a DNS Server
Removing a DNS Server
Set ip dns server ip-addrprimary secondary
Configuring a Default Domain Name
Adding the Default Domain Name
Removing the Default Domain Name
Set ip dns domain name
Configuring and Managing Aliases
Displaying DNS Server Information
Show ip dns
23x0# show ip dns
23x0# set ip alias HR1
Adding an Alias
Set ip alias name ip-addr
Removing an Alias
Clear ip alias name
Configuring and Managing Time Parameters
Displaying Aliases
Show ip alias name
23x0# show ip alias
Clearing the Time Zone
Setting the Time Zone
Displaying the Time Zone
Clearing the Summertime Period
Configuring the Summertime Period
Displaying the Summertime Period
Statically Configuring the System Time and Date
Set timedate date mmm dd yyyy time hhmmss
23x0# set timedate date feb 29 2004 time
Time now is Sun Feb 29 2004, 235802 PST
Displaying the Time and Date
Show timedate 23x0# show timedate
Configuring and Managing NTP
23x0# set ntp server
Adding an NTP Server
Set ntp server ip-addr
Removing an NTP Server
Clear ntp server ip-addrall
23x0# set ntp update-interval
Changing the NTP Update Interval
Set ntp update-interval seconds
Resetting the Update Interval to the Default
Clear ntp update-interval
Set ntp enable disable
Enabling the NTP Client
Show ntp
Managing the ARP Table
Displaying NTP Information
23x0# show arp
Displaying ARP Table Entries
Show arp ip-addr
Adding an ARP Entry
Set arp permanent static dynamic ip-addrmac-addr
23x0# set arp static 10.10.10.1 00bbccddeeff
Success added arp 10.10.10.1 at 00bbccddeeff on Vlan
Changing the Aging Timeout
Pinging Another Device
Set arp agingtime seconds
23x0# set arp agingtime
Logging In to a Remote Device
23x0# telnet
23x0# show sessions telnet client
23x0# clear sessions telnet client
23x0# traceroute server1
IP Interfaces and Services Configuration Scenario
Tracing a Route
23x0# set ip dns server 10.10.10.69 Primary
23x0# set ip route default 10.20.10.1
23x0# set system ip-address
23x0# set ip dns enable
Summertime is enabled, and set to PDT
23x0# set ip dns server 10.20.10.69 Secondary
23x0 # show ip dns
Overview
Configuring Snmp
Configuring Snmp
Setting the System Location and Contact Strings
23x0# set system contact sysadmin1
Set system location string set system contact string
23x0# set system location 3rdfloorcloset
Enabling Snmp Versions
Set snmp protocol v1 v2c usm all enable disable
23x023x0# set snmp protocol all enable
Configuring Community Strings SNMPv1 and SNMPv2c Only
Clear snmp community name comm-string
Creating a USM User for SNMPv3
Clear snmp usm usm-username
Command Examples
23x0# set snmp usm snmpmgr1 snmp-engine-id local
Setting Snmp Security
23x0# set snmp security encrypted
Configuring a Notification Profile
Clear snmp profile profile-name
23x0# set snmp notify profile default send all
Configuring Snmp
Clear snmp notify target target-num
Configuring a Notification Target
Security unsecured authenticated encrypted
23x0# set snmp notify target 2 10.10.40.10 v1 trap
Enabling the Snmp Service
Set ip snmp server enable disable
23x0# set ip snmp server enable
Displaying Snmp Information
Displaying Snmp Version and Status Information
Displaying the Configured Snmp Community Strings
Displaying USM Settings
23x0# show snmp notify profile insert updated example
Displaying Notification Profiles
23x0# show snmp notify target insert updated example
Displaying Notification Targets
Displaying Snmp Statistics Counters
Configuring Snmp 320657-A
Configuring and Managing Mobility Domain Roaming
About the Mobility Domain Feature
Configuring a Mobility Domain
23x0# set mobility-domain mode seed domain-name Pleasanton
Configuring the Seed
Set mobility-domain mode seed domain-name mob-domain-name
Configuring Member WSSs on the Seed
Set mobility-domain member ip-addr
23x0# set mobility-domain mode member seed-ip
Configuring a Member
Set mobility-domain mode member seed-ip ip-addr
Displaying Mobility Domain Status
2370# show mobility-domain status
192.168.14.6
192.168.15.5
This WSS is a member, with seed
Displaying the Mobility Domain Configuration
2370# show mobility-domain config
Clearing a Mobility Domain from a WSS
2370# clear mobility-domain
Clearing a Mobility Domain Member from a Seed
Clear mobility-domain member ip-addr
Displaying Roaming Stations
23x0# show roaming station
Affinity
Displaying Roaming VLANs and Their Affinities
23x0 # show roaming vlan
Understanding the Sessions of Roaming Users
Displaying Tunnel Information
23x0 # show tunnel
State Port
Requirements for Roaming to Succeed
Active
Effects of Timers on Roaming
Mobility Domain Scenario
Monitoring Roaming Sessions
WSS-20show sessions network verbose
23x0# set mobility-domain member seed-ip
23x0# show tunnel
23x0# show mobility-domain config
23x0# show roaming vlan
Configuring User Encryption
Wireless Encryption Defaults
Default Encryption
Configuring WPA
WPA Cipher Suites
WPA Encryption with Tkip Only
WPA Encryption with Tkip and WEP
Tkip Countermeasures
WPA Authentication Methods
WPA Information Element
Client Support
Encryption Support for WPA and Non-WPA Clients
Supported
Configuring WPA
Creating a Service Profile for WPA
Enabling WPA
Specifying the WPA Cipher Suites
Changing the Tkip Countermeasures Timer Value
Enabling PSK Authentication
Set service-profile name auth-psk enable disable
23x0# set service-profile wpa auth-psk enable
Set service-profile name psk-phrase passphrase
Set service-profile name psk-raw hex
Displaying WPA Settings
Show service-profile name ?
23x0# show service-profile wpa
Set radio-profile name service-profile name
Configuring RSN
Creating a Service Profile for RSN
Enabling RSN
Specifying the RSN Cipher Suites
Displaying RSN Settings
23x0# set service-profile rsn cipher-ccmp enable
Configuring WEP
23x0# set radio-profile blgd2 service-profile rsn
Encryption for Dynamic and Static WEP
Setting Static WEP Key Values
Set service-profile name wep key-index num key value
Assigning Static WEP Keys
Encryption Configuration Scenarios
23x0# set service-profile wepsrvc4 wep active-unicast-index
23x0# set service-profile wpa success change accepted
Enabling WPA with Tkip
23x0# show ap config
23x0# set service-profile wpa-wep success change accepted
23x0# show service-profile wpa-wep
23x0# set ap 5,11 radio 1 radio-profile rp2 mode enable
Enabling Dynamic WEP in a WPA Network
Success change accepted
Configuring Encryption for MAC Clients
23x0# set service-profile wpa-wep-for-mac
23x0# show service-profile wpa-wep-for-mac
23x0# show ap config
Configuring User Encryption 320657-A
Configuring AP access points
AP Overview
Example Nortel Network
Country of Operation
Directly Connected APs and Distributed APs
Distributed AP Network Requirements
Distributed APs and STP
Distributed APs and Dhcp Option
Bias High
AP Parameters
Name
Upgrade-firmware Enable
Disable
Resiliency and Dual-Homing Options for APs
Group
Dual-Homed Direct Connections to a Single WSS
Dual-Homed Direct and Distributed Connections to WSSs
Dual-Homed Distributed Connections to WSSs on Both AP Ports
AP Boot Process
Dual-Homed Distributed Connections to WSSs on One AP Port
Configuring AP access points
Configuring AP access points
Configuring AP access points
Example AP Boot over Layer 2 Network
Example AP Boot over Layer 3 Network
Example Boot of Dual-Homed AP
Dual-Homed AP Booting
Session Load Balancing
Service Profiles
Public and Private SSIDs
Dap status command
Encryption
Configuring AP access points
Radio Profiles
RF Auto-Tuning
Default Radio Profile
Tx-power
Radio-Specific Parameters
Channel
Antennatype Internal Nortel external antenna model
Configuring AP access points
Specifying the Country of Operation
Set system countrycode code
WSS
23x0# show system
Configuring a Template for Automatic AP Configuration
How an Unconfigured AP Finds an WSS Switch To Configure It
Configured APs Have Precedence Over Unconfigured APs
Configuring a Template
23x0# show dap config auto
Radio 2 type 802.11a, mode enabled, channel dynamic
Changing AP Parameter Values
23x0# show dap status auto
23x0# set dap auto mode enable
23x0# set dap auto radio 1 radio-profile autodap1
Set dap auto persistent dap-numall
Configuring AP Port Parameters
Setting the Port Type for a Directly Connected AP
Port parameter Setting
Configuring an Indirectly Connected AP
23x0# set port type ap 11-14,16 model 2330 poe enable
Clearing an AP from the Configuration
Changing AP Names
Configuring a Load-Balancing Group
Disabling or Reenabling Automatic Firmware Upgrades
Enabling LED Blink Mode
Changing Bias
Configuring AP-WSS Security
Encryption Key Fingerprint
Encryption Options
RSA aaaaaaaaaaaaaaaa aaaaaaaaaaaaaaaa
Confirming an AP’s Fingerprint on an WSS Switch
23x0# show dap status
Setting the AP Security Requirement on an WSS Switch
Set dap num fingerprint hex
Set dap security require optional
23x0# set dap security require
Fingerprint Log Message
Configuring a Service Profile
Changing the Fallthru Authentication Type
Disabling or Reenabling Encryption for an Ssid
Disabling or Reenabling Beaconing of an Ssid
Configuring AP access points
Configuring a Radio Profile
Set radio-profile name mode enable disable
Creating a New Profile
Changing Radio Parameters
Set radio-profile name beacon-interval interval
23x0# set radio-profile rp1 beacon-interval
Set radio-profile name dtim-interval interval
23x0# set radio-profile rp1 dtim-interval
Set radio-profile name rts-threshold threshold
23x0# set radio-profile rp1 rts-threshold
Set radio-profile name frag-threshold threshold
23x0# set radio-profile rp1 frag-threshold
Set radio-profile name max-rx-lifetime time
23x0# set radio-profile rp1 max-rx-lifetime
Set radio-profile name max-tx-lifetime time
23x0# set radio-profile rp1 max-tx-lifetime
Set radio-profile name 11g-only enable disable
23x0# set radio-profile rp1 11g-only enable
Set radio-profile name preamble-length long short
23x0# set radio-profile rplong preamble-length long
Resetting a Radio Profile Parameter to its Default Value
Removing a Radio Profile
Clear radio-profile name parameter
Clear radio-profile name
Configuring Radio-Specific Parameters
Configuring the Channel and Transmit Power
23x0# set ap 5 radio 2 channel 36 tx-power
Configuring the External Antenna Model
23x0# set ap 11 radio 1 channel 1 tx-power
23x0# set dap 1 radio 1 antennatype ANT1060
Mapping the Radio Profile to Service Profiles
23x0# set radio-profile rp2 service-profile wpaclients
23x0# set ap 11-14,16 radio 2 radio-profile rp1 mode enable
23x0# set ap 6 radio 1 radio-profile rp1 mode disable
Disabling or Reenabling Radios
Assigning a Radio Profile and Enabling Radios
Enabling or Disabling Individual Radios
Set ap port-listdap dap-numradio 1 2 mode enable disable
23x0# set ap 3,7 radio 2 mode disable
23x0# set radio-profile rp1 mode disable
Disabling or Reenabling All Radios Using a Profile
23x0# set radio-profile rp1 mode enable
23x0# clear ap 3 radio
Resetting a Radio to its Factory Default Settings
Clear ap port-listdap dap-numradio 1 2 all
Displaying AP Information
Restarting an AP
Displaying AP Configuration Information
23x0# show dap config
23x0 # show dap global
Displaying a List of Distributed APs
Show dap global dap-numserial-id serial-ID
Show dap unconfigured
23x0 # show dap unconfigured
Displaying Connection Information for Distributed APs
Show dap connection dap-numserial-id serial-ID
Displaying Service Profile Information
23x0 # show service-profile wpaclients
Show radio-profile name ?
23x0 # show radio-profile default
Displaying Radio Profile Information
Displaying AP Status Information
Displaying AP Statistics Counters
23x0 # show ap counters
Totl
116665 7694 11643396 629107 112115 3368239 142900
Configuring RF Auto-Tuning
RF Auto-Tuning Overview
Initial Channel and Power Assignment
Channel Tuning
Channel and Power Tuning
Power Tuning
Tuning the Transmit Data Rate
RF Auto-Tuning Parameters
Changing RF Auto-Tuning Settings
Min-client-rate For 802.11b For 802.11a
Changing Channel Tuning Settings
Disabling or Reenabling Channel Tuning
Changing the Channel Tuning Interval
Changing the Channel Holddown Interval
Changing Power Tuning Settings
Enabling Power Tuning
Changing the Power Tuning Interval
Changing the Power Backoff Interval
23x0# set ap 7 radio 1 auto-tune max-retransmissions
23x0# set ap 7 radio 1 auto-tune max-power
Changing the Client Retransmission Threshold
Displaying RF Auto-Tuning Information
Changing the Minimum Transmit Data Rate
23x0# show ap config 2 radio
Displaying RF Auto-Tuning Settings
23x0# show radio-profile default
Displaying RF Neighbors
23x0# show auto-tune neighbors ap 2 radio
Displaying RF Attributes
23x0# show auto-tune attributes ap 2 radio
Configuring RF Auto-Tuning 320657-A
Wi-Fi Multimedia
How WMM Works in WSS Software
QoS on the WSS Switch
QoS on an AP
WMM in a Nortel Network
WMM Priority Mappings
Set radio-profile name wmm enable disable
Disabling or Reenabling WMM
Displaying WMM Information
23x0# show radio-profile radprof1
Show dap qos-stats dap-numshow dap qos-stats port-list
23x0# show dap qos-stats
Wi-Fi Multimedia
Configuring and Managing Spanning Tree Protocol
Enabling the Spanning Tree Protocol
Set spantree enable disable
23x0# set spantree enable
Snmp Port Path Cost Defaults
Changing Standard Spanning Tree Parameters
Port Priority
23x0# set spantree priority 69 vlan pink
Changing the Bridge Priority
Set spantree priority value all vlan vlan-id
Changing the STP Port Cost
Resetting the STP Port Cost to the Default Value
Changing STP Port Parameters
Resetting the STP Port Priority to the Default Value
Changing the STP Port Priority
23x0# set spantree portpri 3-4 priority
23x0# set spantree portvlanpri 3-4 priority 48 vlan mauve
Changing Spanning Tree Timers
Changing the STP Forwarding Delay
Changing the STP Hello Interval
Changing the STP Maximum Age
Configuring and Managing STP Fast Convergence Features
23x0# set spantree maxage 15 all
Uplink Fast Convergence
23x0# set spantree portfast port 9,11,13 enable
Configuring Port Fast Convergence
Set spantree portfast port port-listenable disable
Port Vlan Portfast Disable Enable
Displaying Port Fast Convergence Information
Show spantree portfast port-list
23x0# show spantree portfast
23x0# set spantree backbonefast enable
Configuring Backbone Fast Convergence
Set spantree backbonefast enable disable
Backbonefast is enabled
Displaying the Backbone Fast Convergence State
Show spantree backbonefast
23x0# show spantree backbonefast
Configuring Uplink Fast Convergence
Set spantree uplinkfast enable disable
Displaying Spanning Tree Information
Displaying Uplink Fast Convergence Information
Show spantree uplinkfast vlan vlan-id
23x0# show spantree uplinkfast
23x0# show spantree vlan mauve
Displaying STP Bridge and Port Information
Show spantree port-listvlan vlan-id active
Displaying the STP Port Cost on a Vlan Basis
Show spantree portvlancost port-list
23x0# show spantree portvlancost
Port 1 Vlan 1 have path cost
Show spantree blockedports vlan vlan-id
23x0# show spantree blockedports vlan default
Displaying Blocked STP Ports
23x0# show spantree statistics 1 Bpdu related parameters
Displaying Spanning Tree Statistics
Show spantree statistics port-listvlan vlan-id
Topology change Timer
Topology change Timer value Hold timer
Hold timer value Delay root port Timer
Delay root port Timer value Timer restarted is
Spanning Tree Configuration Scenario
23x0# set port disable
Clearing STP Statistics
Clear spantree statistics port-listvlan vlan-id
Default None Backbone Down
Spanning tree mode
Disabled 128
23x0# set port enable
Down Auto Network 10/100BaseTx 1000/full
Disabling or Reenabling Proxy Reporting
Set igmp enable disable vlan vlan-id
Disabling or Reenabling Igmp Snooping
Changing Igmp Timers
Set igmp proxy-report enable disable vlan vlan-id
Set igmp querier enable disable vlan vlan-id
Enabling the Pseudo-Querier
Changing the Query Interval
Set igmp qi seconds vlan vlan-id
Changing the Other-Querier-Present Interval
Set igmp oqi seconds vlan vlan-id
Changing the Query Response Interval
Set igmp qri tenth-seconds vlan vlan-id
Changing the Last Member Query Interval
Set igmp lmqi tenth-seconds vlan vlan-id
Set igmp mrsol enable disable vlan vlan-id
Enabling Router Solicitation
Changing Robustness
Set igmp rv num vlan vlan-id
Set igmp mrsol mrsi seconds vlan vlan-id
Configuring Static Multicast Ports
Changing the Router Solicitation Interval
Set igmp mrouter port port-listenable disable
Adding or Removing a Static Multicast Router Port
Adding or Removing a Static Multicast Receiver Port
Set igmp receiver port port-listenable disable
Displaying Multicast Information
192.28.7.5 Dvmrp Group Port Receiver-IP Receiver-MAC
Show igmp vlan vlan-id
23x0# show igmp vlan orange
Displaying Multicast Statistics Only
Clearing Multicast Statistics
Show igmp statistics vlan vlan-id
Clear igmp statistics vlan vlan-id
Displaying Multicast Queriers
Show igmp querier vlan vlan-id
Show igmp querier vlan orange
Querier for vlan orange Port Querier-IP Querier-MAC
Displaying Multicast Routers
Show igmp mrouter vlan vlan-id
Show igmp mrouter vlan orange
192.28.7.5 000102030405 Dvmrp
Vlan red Session Port Receiver-IP Receiver-MAC
Displaying Multicast Receivers
23x0# show igmp receiver-table group 237.255.255.0/24
Configuring and Managing Igmp Snooping 320657-A
Configuring and Managing Security ACLs
About Security Access Control Lists
Overview of Security ACL Commands
Setting Security ACLs
Creating and Committing a Security ACL
Security ACL Filters
23x0# set security acl ip acl-1 permit 192.168.1.4
Setting a Source IP ACL
Common IP Protocol Numbers
Wildcard Masks
Class of Service
Class-of-Service CoS Packet Handling
Configuring and Managing Security ACLs
Setting an Icmp ACL
Common Icmp Message Types and Codes
Common Icmp Message Types and Codes
Setting a UDP ACL
Setting TCP and UDP ACLs
Setting a TCP ACL
Configuring and Managing Security ACLs
Determining the ACE Order
23x0# commit security acl all
Committing a Security ACL
23x0# commit security acl acl-99
Viewing Security ACL Information
Viewing the Edit Buffer
Viewing Committed Security ACLs
Viewing Security ACL Details
Displaying Security ACL Hits
23x0# show security acl hits ACL hit-counters
23x0# clear security acl acl-99
Mapping Security ACLs
Clearing Security ACLs
23x0# set user Natasha attr filter-id acl-222.in
Mapping User-Based Security ACLs
23x0# commit security acl acl-222 success change accepted
Configuring and Managing Security ACLs
Displaying ACL Maps to Ports, VLANs, and Virtual Ports
Clearing a Security ACL Map
23x0# set security acl map acl-222 port 2 tag 1-3,5
23x0# show security acl map acl-999
Modifying a Security ACL
23x0# show security acl map acljoe
ACL acljoe is mapped to
23x0# clear security acl map acljoe port 4
Adding Another ACE to a Security ACL
23x0# show security acl info all
Placing One ACE before Another
Modifying an Existing Security ACL
Clearing Security ACLs from the Edit Buffer
23x0# show security acl editbuffer
ACL edit-buffer table
Type Status Acl-a Not Committed Acl-111
ACL edit-buffer information for all
Using ACLs to Change CoS
23x0# rollback security acl acl-111
Filtering Based on Dscp Values
Enabling Prioritization for Legacy Voice over IP
23x0# set security acl ip voip permit 0.0.0.0
23x0# commit security acl voip
23x0# set security acl map voip vlan corpvlan out
Security ACL Configuration Scenario
Enabling SVP Optimization for SpectraLink Phones
23x0# save config
Why Use Keys and Certificates?
Managing Keys Certificates
Wireless Security through TLS
About Keys and Certificates
PEAP-MS-CHAP-V2 Security
Public Key Infrastructures
Public and Private Keys
Digital Certificates
Crypto generate key command
Creating Keys and Certificates
Pkcs #7, Pkcs #10, and Pkcs #12 Object Files
Pkcs Object Files Supported by Nortel
Managing Keys and Certificates
Procedures for Creating and Validating Certificates
Crypto generate key admin eap ssh webaaa 512 1024
23x0# crypto generate key admin
Admin key pair generated
Creating Public-Private Key Pairs
Generating Self-Signed Certificates
Crypto generate self-signed admin eap webaaa
23x0# crypto generate self-signed admin Country Name US
Crypto otp admin eap webaaa one-time-password
Crypto pkcs12 admin eap webaaa filename
23x0# crypto generate request admin
Installing a CA’s Own Certificate
Begin Certificate
Displaying Certificate and Key Information
Key and Certificate Configuration Scenarios
23x0# show crypto certificate admin Certificate
23x0# crypto generate self-signed admin
Self-signed cert for admin is
Creating Self-Signed Certificates
ENDCERTIFICATE-----23x0#crypto generate self-signed eap
23x0# show crypto certificate eap
23x0# show crypto certificate admin
20# crypto generate self-signed webaaa Country Name US
23x0# show crypto certificate webaaa Certificate
23x0# crypto otp admin SeC%#6@o%c
23x0# crypto pkcs12 admin 2048admn.p12
23x0# copy tftp//192.168.253.1/2048admn.p12 2048admn.p12
23x0# copy tftp//192.168.253.1/20481x.p12 20481x.p12
Keypair Device certificate CA certificate
Email Address admin@example.com
Unstructured Name wiring closet 12 CSR for admin is
23x0# crypto certificate admin
23x0# crypto ca-certificate admin
23x0# show crypto ca-certificate admin
Enter PEM-encoded certificate
Configuring AAA for Network Users
About AAA for Network Users
Authentication
Authentication Types
Authentication Algorithm
Authentication Flowchart for Network Users
To 802.1X? Yes
User Credential Requirements
Ssid Name Any
Last-Resort Processing
Configuring AAA for Network Users
Authorization
CLI
Accounting
Summary of AAA Features
AAA Tools for Network Users
Wildcards and Groups for Network User Classification
Wildcard Any for Ssid Matching
Local Override Exception
AAA Methods for Ieee 802.1X and Web Network Access
AAA Rollover Process
Remote Authentication with Local Backup
Remote Pass-Through or Local Authentication
Ieee 802.1X Extensible Authentication Protocol Types
EAP-MD5
Ways an WSS Switch Can Use EAP
Configuring 802.1X Authentication
Effects of Authentication Type on Encryption Method
Configuring 802.1X Acceleration
Using Pass-Through
Authenticating through a Local Database
Binding User Authentication to Machine Authentication
Authentication Rule Requirements
Bonded Authentication Period
Bonded Authentication Configuration Example
Set dot1x bonded-period seconds
Clear dot1x bonded-period
23x0# set dot1x bonded-period
Displaying Bonded Authentication Configuration Information
Show dot1x config 23x0# show dot1x config
Configuring Authentication and Authorization by MAC Address
Clearing MAC Users and Groups
Adding and Clearing MAC Users and User Groups Locally
Adding MAC Users and Groups
Configuring MAC Authentication and Authorization
23x0# set authentication mac ssid voice 010102030405 local
23x0# set authentication mac ssid voice 010102* local
23x0# set mac-user 000102030405 attr vlan-name red
Configuring Web-based AAA
Changing the MAC Authorization Password for Radius
Set radius server server-nameauthor-password password
23x0# set radius server bigbird author-password h00per
How Portal Web-based AAA Works
Web-based AAA Requirements and Recommendations
WSS Requirements
Configuring AAA for Network Users
WSS Recommendations
Client NIC Requirements
Client Web Browser Requirements
Client Web Browser Recommendations
23x0# set user web-portal-mycorp attr vlan-name corpvlan
Configuring Portal Web-based AAA
Portal Web-based AAA Configuration Example
23x0# show config
23x0# show sessions network ssid mycorp
23x0# show sessions network ssid mycorp
Using a Custom Login
TitleMy Corp webAAA/title
Copying and Modifying the Nortel Login
Custom Login Page Scenario
H3Welcome to Mycorp’s Wireless LAN/h3
BWARNING/b My corp’s warning text
23x0# mkdir mycorp-webaaa success change accepted
23x0# dir mycorp-webaaa
Using Dynamic Fields in Web-based AAA Redirect URLs
Variables for Redirect URLs Description
Configuring Last-Resort Access
Configuring AAA for Users of Third-Party APs
WSS Switch Serving as Radius Proxy
Authentication Process for 802.1X Users of a Third-Party AP
Third-Party AP Requirements
WSS Switch Requirements
Requirements
Set authentication mac wired mac-addr-wildcard method1
23x0# set port type wired-auth 3-4 tag
23x0# set authentication mac wired aabbcc010101 srvrgrp1
Set radius proxy port port-listtag tag-valuessid ssid-name
23x0# set authentication proxy ssid mycorp ** srvrgrp1
23x0# set radius proxy client address 10.20.20.9 key radkey1
Assigning Authorization Attributes
End-date
Idle-timeout
Service-type
Session-timeout
Filter-id
Time-of-day
Ssid
Start-date
Url
Vlan-name
Assigning Attributes to Users and Groups
Assigning a Security ACL to a User or a Group
Assigning a Security ACL Locally
23x0# set user Jose attr filter-id acl-101.in
23x0# set usergroup eastcoasters attr filter-id acl-101.in
Assigning a Security ACL on a Radius Server
Clearing a Security ACL from a User or Group
Clear mac-usergroup groupname attr filter-id
23x0# set mac-usergroup mac-fans attr encryption-type
Assigning Encryption Types to Wireless Users
Assigning and Clearing Encryption Types Locally
Assigning and Clearing Encryption Types on a Radius Server
About the Location Policy
How the Location Policy Differs from a Security ACL
23x0# set location policy deny if user eq *.theirfirm.com
Setting the Location Policy
Applying Security ACLs in a Location Policy Rule
Displaying and Positioning Location Policy Rules
WSS-20show location policy
Clear location policy rule-number
Configuring Accounting for Wireless Network Users
Set accounting admin console dot1x mac web
Configuring AAA for Network Users
Viewing Local Accounting Records
Viewing Roaming Accounting Records
WSS-20-0013#show accounting statistics
WSS-20-0017#show accounting statistics
May 21 Acct-Status-Type=STOP Acct-Authentic=2
Set authentication admin Jose sg3
Server Addr Ports
Rs-3
Rs-4
Avoiding AAA Problems in Configuration Order
Set authentication web ssid any ** sg1
Set authentication web ssid corpa ** corpasrvr
Vlan-Name = k2
Configuring AAA for Network Users
Using Authentication and Accounting Rules Together
Configuration Producing an Incorrect Processing Order
Configuration for a Correct Processing Order
23x0# set accounting dot1x ssid mycorp * start-stop group1
Configuring a Mobility Profile
23x0# set mobility-profile name roses-profile port 2-4,7,9
Network User Configuration Scenarios
23x0# set mobility-profile mode enable
23x0# show mobility-profile Mobility Profiles
NamePorts ========================= Roses-profile
General Use of Network User Commands
23x0# set user EXAMPLE\username attr filter-id acl-101.in
23x0# show security acl info acl-101
Mobility Profiles NamePorts ========================= Tulip
WSS-20save config
Enabling Radius Pass-Through Authentication
23x0# set radius server r1 address 10.1.1.1 key sunny
Enabling PEAP-MS-CHAP-V2 Authentication
23x0# set user Natasha password moon
23x0# set user Natasha attr session-timeout
Unstructured Name wiring closet
Enabling PEAP-MS-CHAP-V2 Offload
23x0# set radius server r1 address 10.1.1.1 key starry
23x0# set radius server r1 address 10.1.1.1 key starry
Overriding AAA-Assigned VLANs
Configuring Communication with Radius
Radius Overview
Configuring Communication with Radius
Configuring Radius Servers
Before You Begin
Configuring Global Radius Defaults
Clear radius deadtime key retransmit timeout
23x0# set radius deadtime
23x0# set radius key r8gney
23x0# clear radius client system-ip
Setting the System IP Address as the Source Address
23x0# set radius client system-ip
Configuring Individual Radius Servers
Set radius server server-nameaddress ip-address key string
Clear radius server server-name
Configuring Radius Server Groups
Deleting Radius Servers
Ordering Server Groups
Configuring Load Balancing
Creating Server Groups
Set server group group-nameload-balance enable
Adding Members to a Server Group
Clear server group group-nameload-balance
23x0 # show aaa
Configuring Communication with Radius
Radius and Server Group Configuration Scenario
Deleting a Server Group
23x0# set server group shorebirds load-balance enable
Managing 802.1X on WSS Switch
Managing 802.1X on Wired Authentication Ports
Set dot1x authcontrol enable disable
23x0# set dot1x authcontrol enable
Success dot1x authcontrol enabled
Enabling and Disabling 802.1X Globally
Setting 802.1X Port Control
Managing 802.1X Encryption Keys
Set dot1x key-tx enable disable
23x0# set dot1x key-tx enable
Success dot1x key transmission enabled
Enabling 802.1X Key Transmission
Configuring 802.1X Key Transmission Time Intervals
Set dot1x tx-period seconds
23x0# set dot1x tx-period
Success dot1x tx-period set to
Managing WEP Keys
Configuring 802.1X WEP Rekeying
Configuring the Interval for WEP Rekeying
Setting EAP Retransmission Attempts
Managing 802.1X Client Reauthentication
23x0# set dot1x max-req
Success dot1x max request set to
Enabling and Disabling 802.1X Reauthentication
Set dot1x reauth enable disable
23x0# set dot1x reauth enable
Success dot1x reauthentication enabled
Set dot1x reauth-max number-of-attempts
23x0# set dot1x reauth-max
Success dot1x max reauth set to
23x0# clear dot1x reauth-max
Setting the 802.1X Reauthentication Period
Success dot1x auth-server timeout set to
Set dot1x reauth-period seconds
23x0# set dot1x reauth-period
Clear dot1x max-req
Managing Other Timers
Setting the Bonded Authentication Period
Setting the 802.1X Quiet Period
Set dot1x quiet-period seconds
23x0# set dot1x quiet-period
Success dot1x quiet period set to
Setting the 802.1X Timeout for an Authorization Server
Set dot1x timeout auth-server seconds
23x0# set dot1x timeout auth-server
23x0# clear dot1x timeout auth-server
Setting the 802.1X Timeout for a Client
Displaying 802.1X Information
Viewing 802.1X Clients
23x0# show dot1x clients
Viewing the 802.1X Configuration
Viewing 802.1X Statistics
23x0# show dot1x stats
Managing 802.1X on the WSS Switch 320657-A
Displaying and Clearing Administrative Sessions
Show sessions admin console telnet client
Clear sessions admin console telnet client session-id
Managing Sessions
23x0# clear sessions admin
Displaying and Clearing All Administrative Sessions
WSS-20 show sessions admin
Displaying and Clearing an Administrative Console Session
WSS-20 show sessions console
Tty Username Time Type Tty0 5310 Console Console session
23x0# clear sessions console
Displaying and Clearing Administrative Telnet Sessions
Tty Username Time Type Tty3 Sshadmin 2099
WSS-20 show sessions telnet
Telnet session
Displaying and Clearing Network Sessions
Displaying and Clearing Client Telnet Sessions
23x0 # show sessions network
User Sess IP or MAC
Displaying Verbose Network Session Information
Jose@example.com 5125 Vlan-eng
003065168d69 4385 Vlan-wep
761 000bbe154656 none
Displaying and Clearing Network Sessions by Username
Show sessions network user user-wildcard
23x0# show sessions network user E
Clear sessions network user user-wildcard
Displaying and Clearing Network Sessions by MAC Address
Show sessions network mac-addr mac-addr-wildcard
Show sessions net mac-addr 01055d7e981a
Clear sessions network mac-addr mac-addr-wildcard
Displaying and Clearing Network Sessions by Vlan Name
Show sessions network vlan vlan-wildcard
Show sessions network vlan west
Clear sessions network vlan vlan-wildcard
2370# clear sessions network session-id
Displaying and Clearing Network Sessions by Session ID
Clear sessions network session-id session-id
Managing System Files
About System Files
Displaying Software Version Information
Show version details
23x0# show version
23x0# show version details
W2 N/A
Working with Files
Displaying Boot Information
23x0# show boot
Displaying a List of Files
23x0# dir old
23x0# copy floor2WSS tftp//10.1.1.1/floor2WSS-backup
Copying a File
23x0# copy floor2WSS tftp//10.1.1.1/floor2WSS
Success sent 365 bytes in 0.401 seconds 910 bytes/sec
Successreceived9163214bytesin105.939seconds Bytes/sec
23x0# copy tftp//10.1.1.1/newconfig newconfig
23x0# copy tftp//10.1.1.1/newconfig WSSconfig
23x0# copy testconfig tftp//10.1.1.1/testconfig
23x0# delete testconfig
Deleting a File
Delete url
Creating a Subdirectory
23x0# mkdir corp2
23x0# rmdir corp2
Managing Configuration Files
Removing a Subdirectory
23x0# show config area vlan
Displaying the Running Configuration
Show config area area all
Managing System Files
Saving Configuration Changes
Save config filename
23x0# save config newconfig
Success configuration saved to newconfig
Success boot config set
Set boot configuration-file filename
23x0# set boot configuration-file floor2WSS
23x0# load config newconfig
Loading a Configuration File
Load config url
Resetting to the Factory Default Configuration
Backing Up and Restoring the System
Managing System Files
Managing Configuration Changes
Backup and Restore Examples
23x0# backup system tftp/10.10.20.9/sysabak critical
23x0# restore system tftp/10.10.20.9/sysabak
Upgrading the System Image
Managing System Files 320657-A
Rogue Detection Countermeasures
About Rogues and RF Detection
Rogue Detection Lists
Rogue access points and Clients
Rogue Classification
Rogue Detection and Countermeasures
Rogue Detection Algorithm
RF Detection Scans
Dynamic Frequency Selection DFS
Summary of Rogue Detection Features
Countermeasures
Configuring Rogue Detection Lists
Configuring a Permitted Vendor List
Set rfdetect vendor-list client ap mac-addr
Show rfdetect vendor-list
23x0# show rfdetect vendor-list Total number of entries
Configuring a Permitted Ssid List
Set rfdetect ssid-list ssid-name
Show rfdetect ssid-list
23x0# show rfdetect ssid-list Total number of entries
Configuring a Client Black List
Set rfdetect black-list mac-addr
Show rfdetect black-list
23x0# show rfdetect black-list
Configuring an Attack List
Set rfdetect attack-list mac-addr
Show rfdetect attack-list
23x0# show rfdetect attack-list
Configuring an Ignore List
Enabling Countermeasures
Disabling or Reenabling Active Scan
Enabling AP Signatures
Set rfdetect log enable disable
Disabling or Reenabling Logging of Rogues
Enabling Rogue and Countermeasures Notifications
IDS and DoS Alerts
Flood Attacks
DoS Attacks
Netstumbler and Wellenreiter Applications
Wireless Bridge
Ad-Hoc Network
Weak WEP Key Used by Client
Disallowed Devices or SSIDs
Displaying Statistics Counters
IDS Log Message Examples
IDS and DoS Log Messages
Message Type
Displaying RF Detection Information
Show rfdetect attack-list
Show rfdetect ignore
Displaying Rogue Clients
Show rfdetect clients mac mac-addr
23x0# show rfdetect clients mac 000c4163fd6d
23x0# show rfdetect clients
23x0# show rfdetect counters
Displaying Rogue Detection Counters
Show rfdetect counters
Displaying Ssid or Bssid Information for a Mobility Domain
Show rfdetect mobility-domain ssid ssid-namebssid mac-addr
23x0# show rfdetect mobility-domain
23x0# show rfdetect mobility-domain ssid nrtl-webaaa
23x0# show rfdetect mobility-domain bssid 000b0e0004d1
23x0 # show rfdetect data
Displaying RF Detect Data
Show rfdetect data
Displaying the APs Detected by an AP Radio
23x0# show rfdetect visible ap 3 radio
23x0# show rfdetect countermeasures
Displaying Countermeasures Information
Show rfdetect countermeasures
Rogue Detection and Countermeasures 320657-A
Appendix a Troubleshooting a WS Switch
Fixing Common WSS Setup Problems
WSS Setup Problems and Remedies
Symptom Diagnosis
Recovering the System Password
Boot boot OPT+=default
WSS-2350
WSS-2370, WSS-2380, or WSS-2360
Configuring and Managing the System Log
Log Message Components
Logging Destinations and Levels
Info
Debug
Using Log Commands
Logging to the Log Buffer
Logging to the Console
Logging Messages to a Syslog Server
Setting Telnet Session Defaults
Changing the Current Telnet Session Defaults
Saving Trace Messages in a File
Displaying the Log Configuration
Logging to the Trace Buffer
Using the Trace Command
Tracing Authentication Activity
Running Traces
Tracing Session Manager Activity
Tracing Authorization Activity
Displaying a Trace
Stopping a Trace
Tracing 802.1X Sessions
Displaying Trace Results
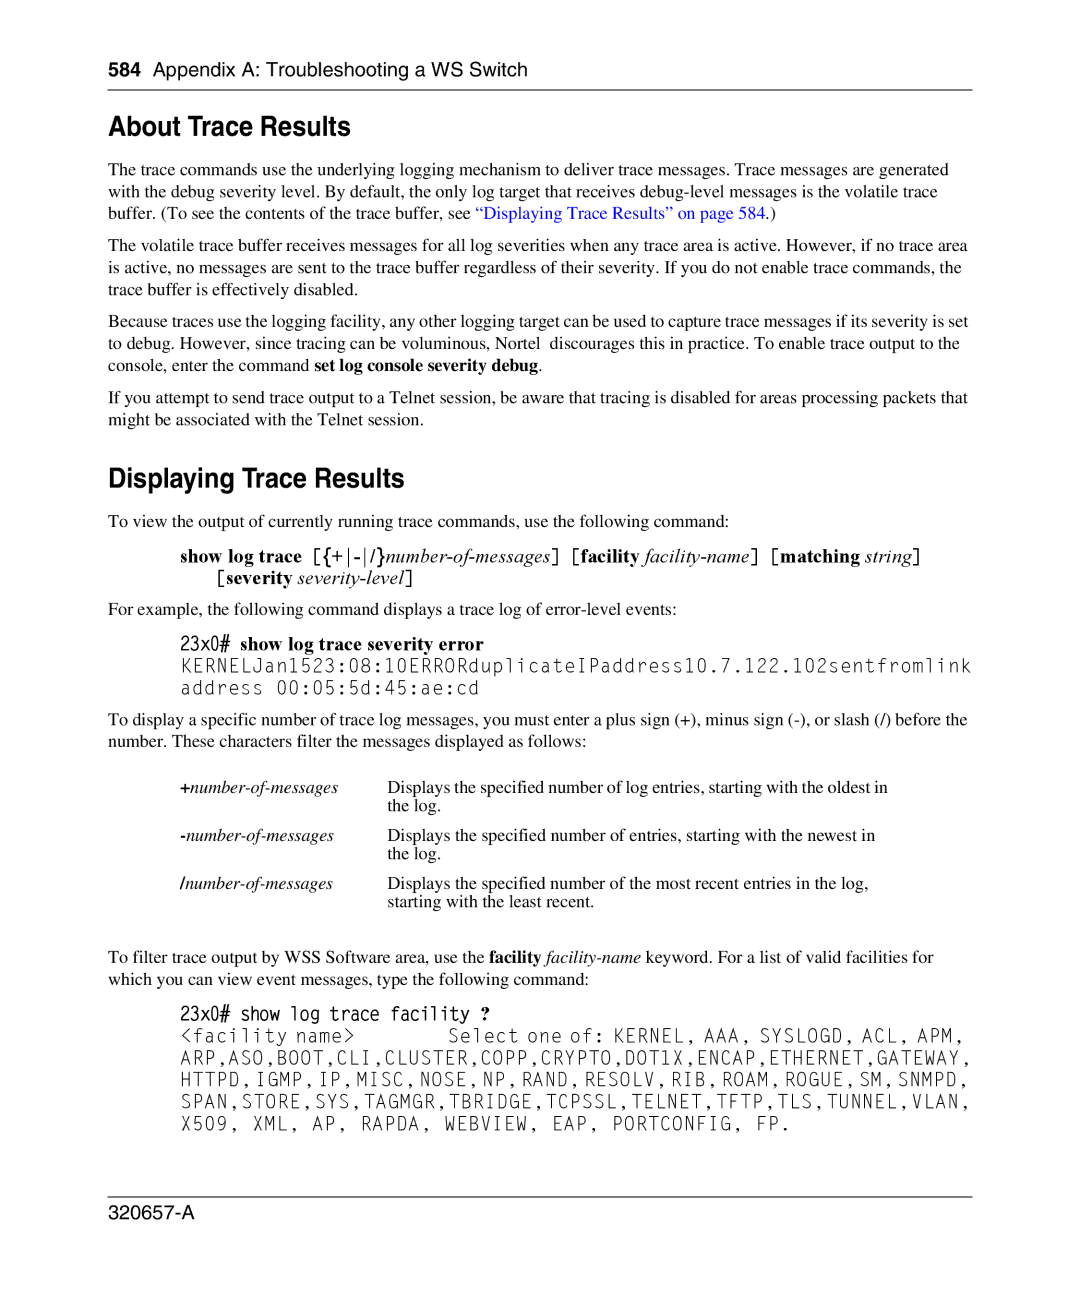
23x0# show log trace severity error
About Trace Results
List of Trace Areas
Copying Trace Results to a Server
Clearing the Trace Log
Using Show Commands
Viewing Vlan Interfaces
Viewing AAA Session Statistics
WSS-2370# show interface
Viewing FDB Information
Viewing ARP Information
Vlan-name = vlan-wep
23x0# show fdb
Using Snoop Filters on Radios That Use Active Scan
Remotely Monitoring Traffic
How Remote Traffic Monitoring Works
Best Practices for Remote Traffic Monitoring
Appendix a Troubleshooting a WS Switch
Configuring a Snoop Filter
23x0# set snoop snoop1 observer 10.10.30.2 snap-length
Displaying Configured Snoop Filters
Mapping a Snoop Filter to a Radio
Editing a Snoop Filter
Deleting a Snoop Filter
Enabling or Disabling a Snoop Filter
Displaying the Snoop Filters Mapped to a Radio
Displaying the Snoop Filter Mappings for All Radios
Removing Snoop Filter Mappings
23x0# set snoop snoop1 mode enable stop-after
Success filter snoop1 enabled
Show snoop stats filter-namedap-numradio 1
Displaying Remote Traffic Monitoring Statistics
Preparing an Observer and Capturing Traffic
Capturing System Information for Technical Support
Displaying Technical Support Information
Sending Information to Nets
23x0# show tech-support file fortechsupport
Success results saved to fortechsupport.gz
23x0# copy fortechsupport.gz tftp//tftpserver/filename.gz
Appendix a Troubleshooting a WS Switch 320657-A
Appendix B Supported Radius Attributes
Supported Standard and Extended Attributes
801.1X Attributes
801.1X Attributes
Radius
Nortel Vendor-Specific Attributes
Nortel VSAs
Appendix C Mobility Domain Traffic Ports
Protocol Port Function
Appendix C Mobility Domain Traffic Ports 320657-A
Appendix D Dhcp Server
Configuring the Dhcp Server
How the WSS Software Dhcp Server Works
23x0# show dhcp-server
Displaying Dhcp Server Information
Show dhcp-server interface vlan-id verbose
Appendix D Dhcp Server
Glossary
Advanced Encryption Standard See AES
Authentication, authorization, and accounting See AAA
CBC-MAC See Ccmp
Cyclic redundancy check See CRC
Glossary
EAP with Transport Layer Security See EAP-TLS
Group master key See GMK
Group transient key See GTK
Industry Canada See IC Information element See WPA IE
Media access control address See MAC address
Microsoft Challenge Handshake Authentication
Per-VLAN Spanning Tree protocol See PVST+
Port address translation See PAT Power over Ethernet See PoE
Quality of service See QoS
Remote Authentication Dial-In User Service See Radius
Spanning Tree Protocol See STP
Temporal Key Integrity Protocol See Tkip
Type, length, and value See TLV
Wisp
WPA information element See WPA IE
Glossary 320657-A
Index
Numerics
Index
Index
DNS
Enable password
Description
Subnet masks for, notation conventions System IP address
366 To ports, VLANs, or virtual ports 368
Index
Radius
Https
Index
Configuring 341 rogue access points detecting
TCP
Snmp
STP
Uplink fast convergence
Index
WMS
Index 320657-A
Command Index
Command Index
Set dap auto radiotype
Command Index
Command Index
324 Show spantree blockedports 329