P-2602H(W)(L)-DxA Series User’s Guide
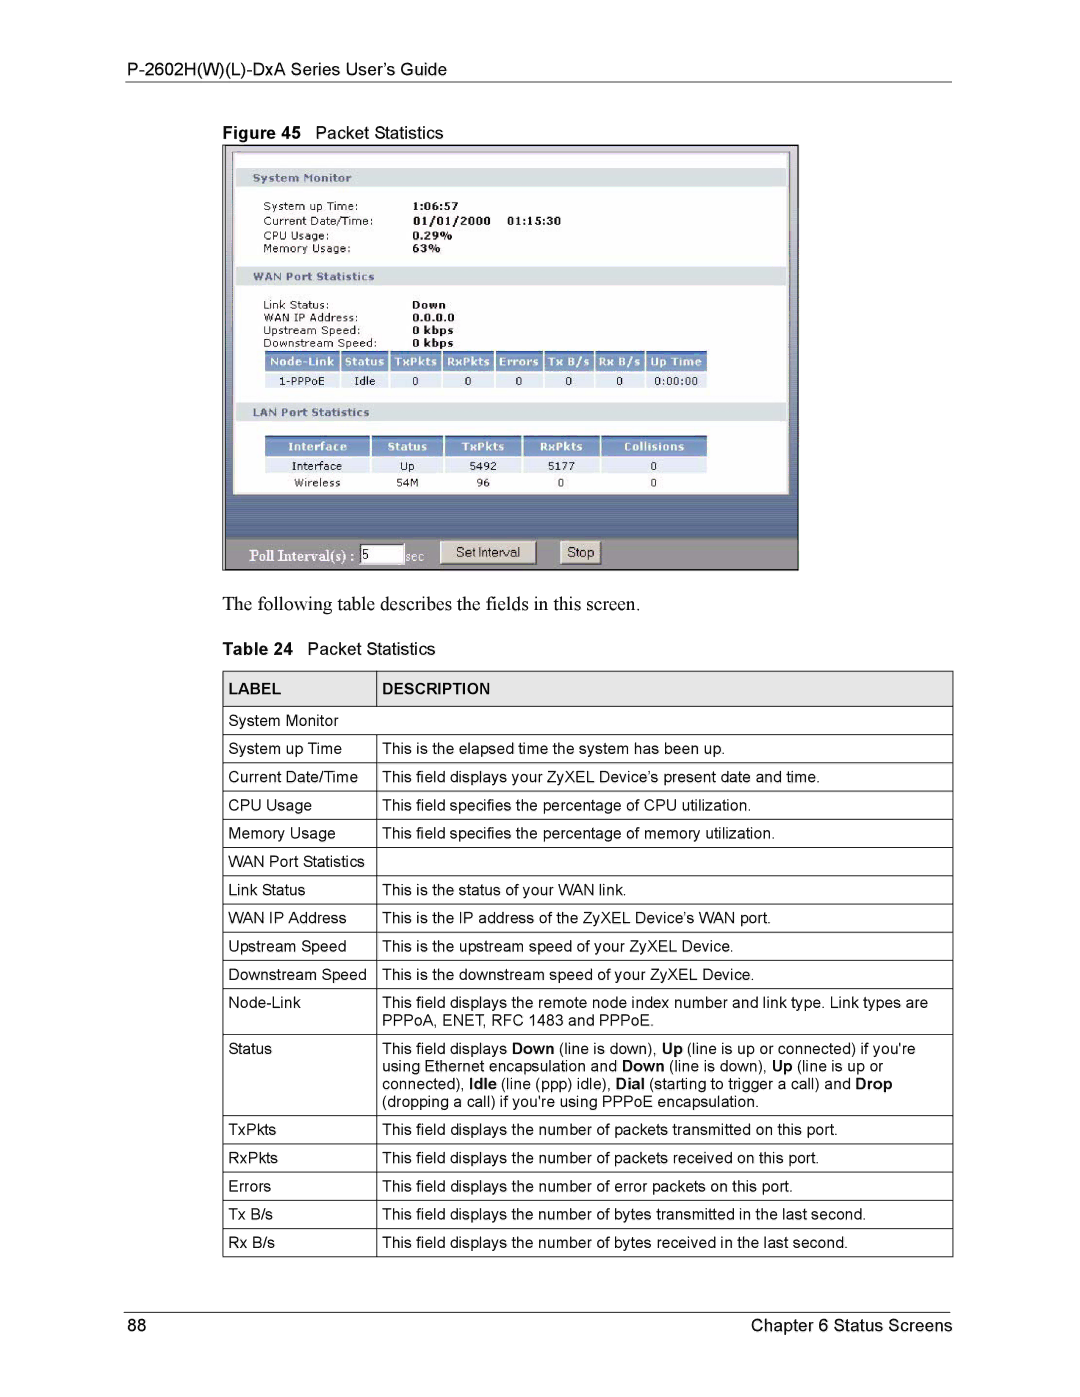
Figure 45 Packet Statistics
The following table describes the fields in this screen.
Table 24 Packet Statistics
LABEL | DESCRIPTION |
|
|
System Monitor |
|
|
|
System up Time | This is the elapsed time the system has been up. |
|
|
Current Date/Time | This field displays your ZyXEL Device’s present date and time. |
|
|
CPU Usage | This field specifies the percentage of CPU utilization. |
|
|
Memory Usage | This field specifies the percentage of memory utilization. |
|
|
WAN Port Statistics |
|
|
|
Link Status | This is the status of your WAN link. |
|
|
WAN IP Address | This is the IP address of the ZyXEL Device’s WAN port. |
|
|
Upstream Speed | This is the upstream speed of your ZyXEL Device. |
|
|
Downstream Speed | This is the downstream speed of your ZyXEL Device. |
|
|
This field displays the remote node index number and link type. Link types are | |
| PPPoA, ENET, RFC 1483 and PPPoE. |
Status | This field displays Down (line is down), Up (line is up or connected) if you're |
| using Ethernet encapsulation and Down (line is down), Up (line is up or |
| connected), Idle (line (ppp) idle), Dial (starting to trigger a call) and Drop |
| (dropping a call) if you're using PPPoE encapsulation. |
TxPkts | This field displays the number of packets transmitted on this port. |
|
|
RxPkts | This field displays the number of packets received on this port. |
|
|
Errors | This field displays the number of error packets on this port. |
|
|
Tx B/s | This field displays the number of bytes transmitted in the last second. |
|
|
Rx B/s | This field displays the number of bytes received in the last second. |
|
|
88 | Chapter 6 Status Screens |
