|
|
| |
| Table 24 Packet Statistics (continued) | ||
|
|
|
|
| LABEL | DESCRIPTION |
|
|
|
|
|
| Up Time | This field displays the elapsed time this port has been up. |
|
|
|
|
|
| LAN Port Statistics |
|
|
|
|
|
|
| Ethernet | This field displays either Ethernet (LAN ports) or Wireless (WLAN port). |
|
|
|
|
|
| Status | For the LAN ports, this field displays Down (line is down) or Up (line is up or |
|
|
| connected). |
|
|
| For the WLAN port, it displays the transmission rate when WLAN is enabled or |
|
|
| N/A when WLAN is disabled. |
|
| TxPkts | This field displays the number of packets transmitted on this interface. |
|
|
|
|
|
| RxPkts | This field displays the number of packets received on this interface. |
|
|
|
|
|
| Collisions | This is the number of collisions on this interfaces. |
|
|
|
|
|
| Poll Interval(s) | Type the time interval for the browser to refresh system statistics. |
|
|
|
|
|
| Set Interval | Click this to apply the new poll interval you entered in the Poll Interval field |
|
|
| above. |
|
| Stop | Click this button to halt the refreshing of the system statistics. |
|
|
|
|
|
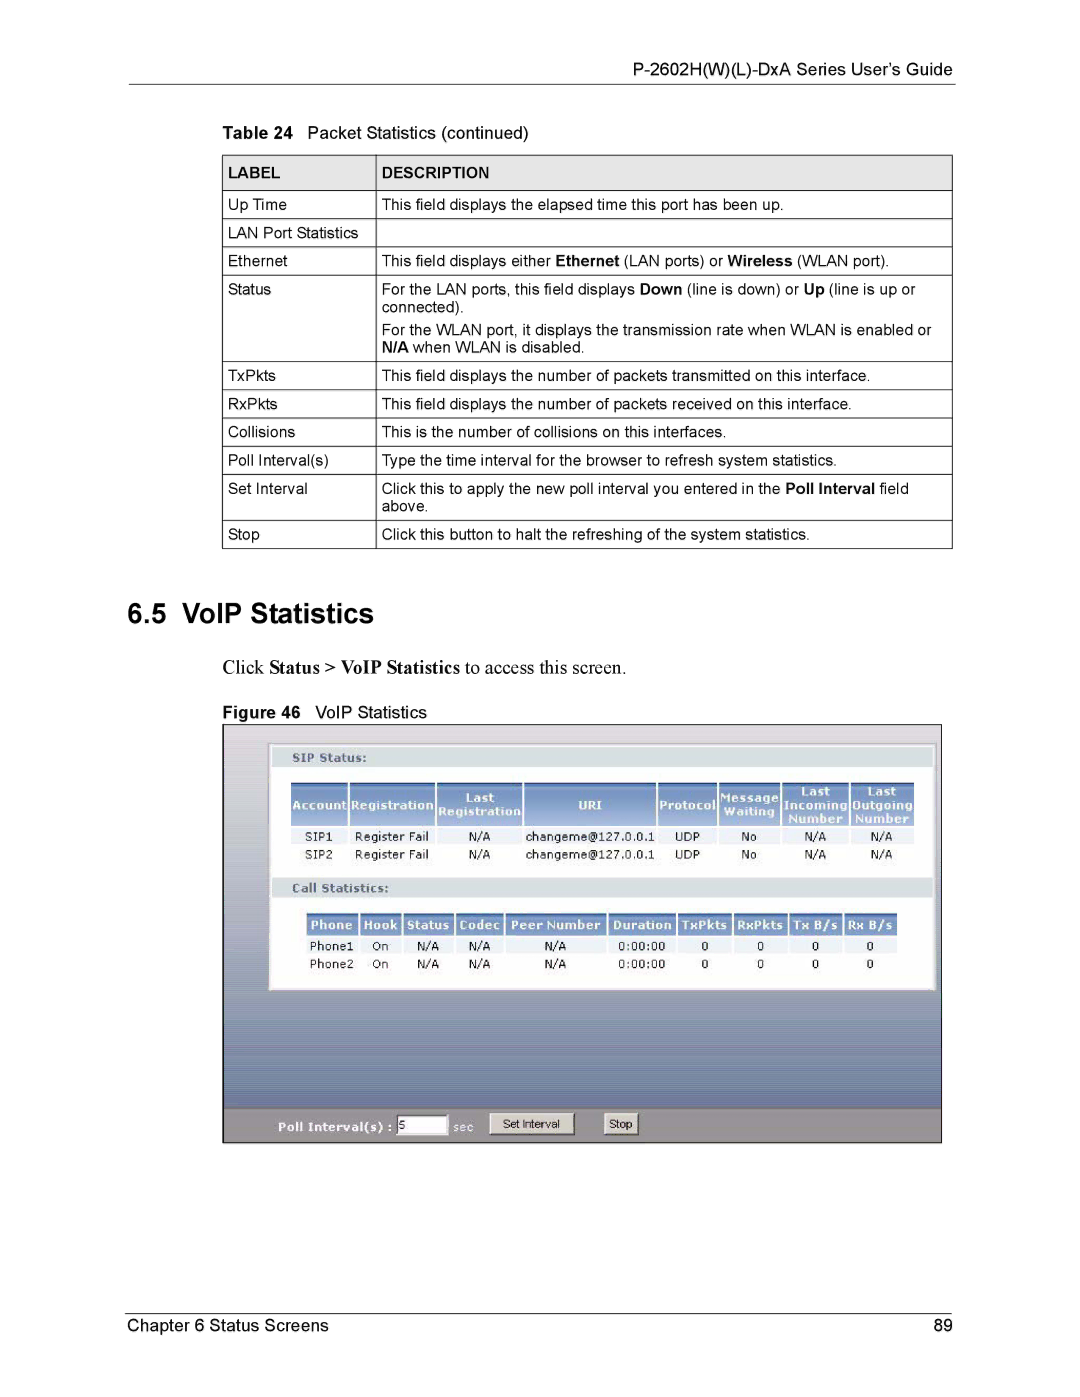
6.5 VoIP Statistics
Click Status > VoIP Statistics to access this screen.
Figure 46 VoIP Statistics
Chapter 6 Status Screens | 89 |