Manual
Page
7UGT/CPWCN
Trademarks
Table of Contents
Interfaces and Indicators
Installation, Setup, and Operation
Troubleshooting and Customer Support
Advanced Energy 5708009-C
List of Figures
Advanced Energy 5708009-C
List of Tables
Advanced Energy 5708009-C
Read this Section
Using this Manual to Find Information for Your Generator
Understanding PIN Numbers and Apex Configuration
Using the PIN to Locate Information in the Manual
Serial number identification tag
Using the PIN to Identify Apex Options
DeviceNet option
Apex Feature Options, Descriptions, and Cross-References
PIN
Apex 1 to 5.5 kW Generator
PIN
PIN
PIN
Interpreting the Manual and Unit Labels
Type Conventions
Icons Symbols
Apex 1 to 5.5 kW Generator
Safety
Product SAFETY/COMPLIANCE
Directives and Standards
Directive Description
Certification
Installation Requirements
Conditions of Use
General Description
Functional Description
Regulation
Cooling
Interlock
Optional Water Solenoid
Grounding
Protection
Theory of operation block diagram Block Diagram Explanation
Advanced Energy 5708009-C
Specifications
Physical Specifications
Description PIN Option-Specification
Weight
Size
Clearance
RF Connector location
AC power input connector
RF output connector
Water control connectors
Connector
CEX connector
Coolant connectors
Description PIN Option and Specification
Electrical Specifications
Input Power Specifications
Output Electrical Specifications
Line frequency
Line current
Regulation modes
Full-rated output power
Delivered power into
Output impedance
Vswr loads
Line regulation
Output power regulation accuracy
Load regulation as a function
Other Electrical Specifications
Cooling Specifications
Description Specification
Temperature
Flow rate
Heat removal
Contaminates
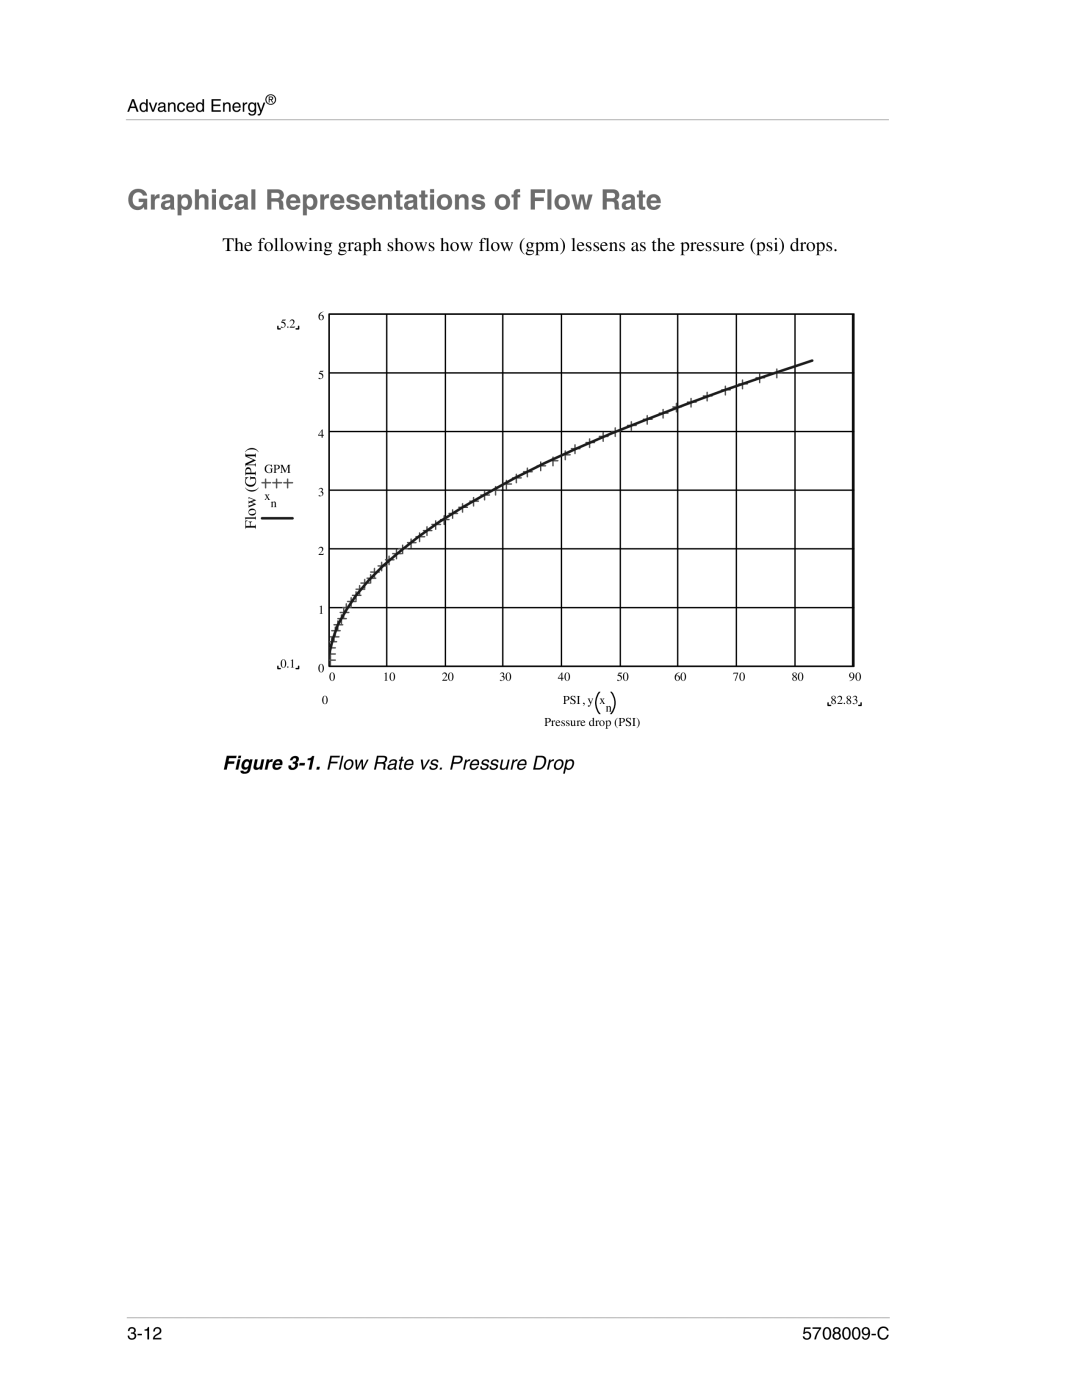
Graphical Representations of Flow Rate
Flow Rate vs. Pressure Drop
Water Flow vs Inlet Temp Apex Generator
Environmental Specifications
Temperature Relative Humidity Air Pressure Operating
Storage
Transportation
Interfaces and Indicators
Apex User Port Options
Pin Apex Standard User Port
PIN Descriptions for the 25-PIN User Port
Satisfying Minimal Requirements for the 25-PIN User Port
Interface Cabling Requirements for 25-PIN User Port
Signal Return Name Description Pin
Monitor
RF PWR on
DC BIAS/POWER
Overtemp
DC BUS OK
Wiring Diagrams for the Standard 25-PIN User Port
Return DC BUS OK
Advanced Energy
Apex 1 to 5.5 kW Generator
Advanced Energy
Apex 1 to 5.5 kW Generator
Advanced Energy
Apex 1 to 5.5 kW Generator
Pin User Port Exclusive-Option D
Apex 15-pin User port, option D
User port connector 15 Pin Exclusive for configuration D
Interface Cabling Requirements for Option D User Port
PIN Descriptions for Option D User Port
Status
RF Power
Wiring Diagrams for Option D 15-PIN User Port
RF on Bias
Apex 1 to 5.5 kW Generator
Advanced Energy
Apex 1 to 5.5 kW Generator
Advanced Energy
Apex 1 to 5.5 kW Generator
Apex 15-pin User port configuration E option
Pin User Port Exclusive-Option E
Interface Cabling Requirements for Option E User Port
PIN Description for Option E User Port
Analog This analog signal
RF Power Enable
Voltage +15 Vdc provided to
When connected
Wiring Diagrams for Option E User Port
Apex 1 to 5.5 kW Generator
Advanced Energy
Apex 1 to 5.5 kW Generator
Advanced Energy
Apex Host Port Options
Host Port-RS-232 With AE Bus
RS-232, AE Bus Host port connector
To Connect the Computer to the Apex unit
Communicating Through the RS-232, AE BUS Host Port
Signal Name Description Pin
RS-232, AE BUS Host Port Cabling Requirements
AE BUS Protocol
Graphic representation of a RS-232, AE Bus message packet
Header
Checksum
Creating AN Ideal Communications Transaction
HOST/APEX Communications Transaction Example
Command Status Response CSR CODES-RS-232, AE BUS Host
Value Meaning
Command SET for the RS-232, AE BUS Host Port
Command Number Description
Bytes Data Bytes
Fwd pwr
Out-of
Timer
Max ext
Host port
Timeout
Allowable
Baud
Response
Port
Latch
Duty cycle
119
Explicit
Bytes Data Bytes 130
Mainframe
140
Time-out
Bytes Data Bytes 162
Status
Bytes Data Bytes 164
165
166
167
Bytes Data Bytes 171
Dissipation
184
185
Bytes Data Bytes 188
Run times
189
Status,
Bytes Data Bytes 201
202
203
205
Bytes Data Bytes 212
Report data
Data
Host Port-Profibus
Bytes Data Bytes 219
Data
221
Host port connector with Profibus
AE Profibus Protocol
Profibus Type Files GSD Files
Profibus Termination
Profibus-Specific Errors
PROFIBUS/APEX Software Commands
Byte Description
10.Upload Status Bytes
Apex 1 to 5.5 kW Generator
Profibus Command SET
Command Description Number
Allowable
Life
184
By CMD
Mainframe
Number
Packet contains the following bytes arranged Four 8-bit
Forward
Read fwd
Pwr limit
CMD
Out of setpoint before it starts the out-of Bit value
Signal Name Description
Host Port-DeviceNet
Devicenet Interface Characteristics
Canl
Devicenet Rotary Switches Baud Rate and Addressing
Devicenet Control Panel Leds
LED
State Meaning
Devicenet Operation
DeviceNet Poll Command Message
Byte Bit
17.Response Message
Apex Status Indicators Leds
Indicator Description
Apex Panel Illustrations
Overtemp
11. Front Panel
12. Rear panel
Installing the Generator
Unpacking
Spacing Requirements
Apex dimensions
Connecting Cooling Water
Installing the Optional Water Control
Mounting the Generator
To Connect Cooling Water
Connecting Output Power
Pin Description
Connecting Input Power
Provides a basic drawing of the output connectors
ODU Connector
ODU input connector
ODU input connector
NONTERMINATED, FOUR-CONDUCTOR Pigtail
Harting Type HAN-Q Connector
Nonterminated, four-conductor pigtail input options
Connecting I/O and Auxiliary Connectors
Shows the Harting Type Han-Q input connector
To Control the Generator Through a User Port
To Control the Generator Through a Host Port
To USE the Common Exciter CEX Feature Optional
First Time Operation
Understanding and Setting UP Pulsing Output
Normal Operation
Enabling and Setting Pulsing
Understanding Pulsing
Troubleshooting Guide
Checks with the Power Off
Advanced Energy
Troubleshooting Questions
Troubleshooting Procedures
Alarm LED Lit
AC On LED not Lit
Overtemp LED on Solid
RF on LED Flashing
Power Limit LED is Lit
Interlock LED is not Lit
External Load Checks Open/Short RF Output Path
Error Codes
Error Code Error Code Description Solution
E000
E001
E011
E012
E016
E017
E033
E020
E025
E050
E051
E054
E055
AE Customer Support
E105
E111
Office Telephone
Returning Units for Repair
Warranty
Authorized Returns
Warranty Statement
Index
Filing a claim
Vswr loads
Terminal pin descriptions non-terminated 3m and 12’ pigtail