Increasing revenue
Measuring results
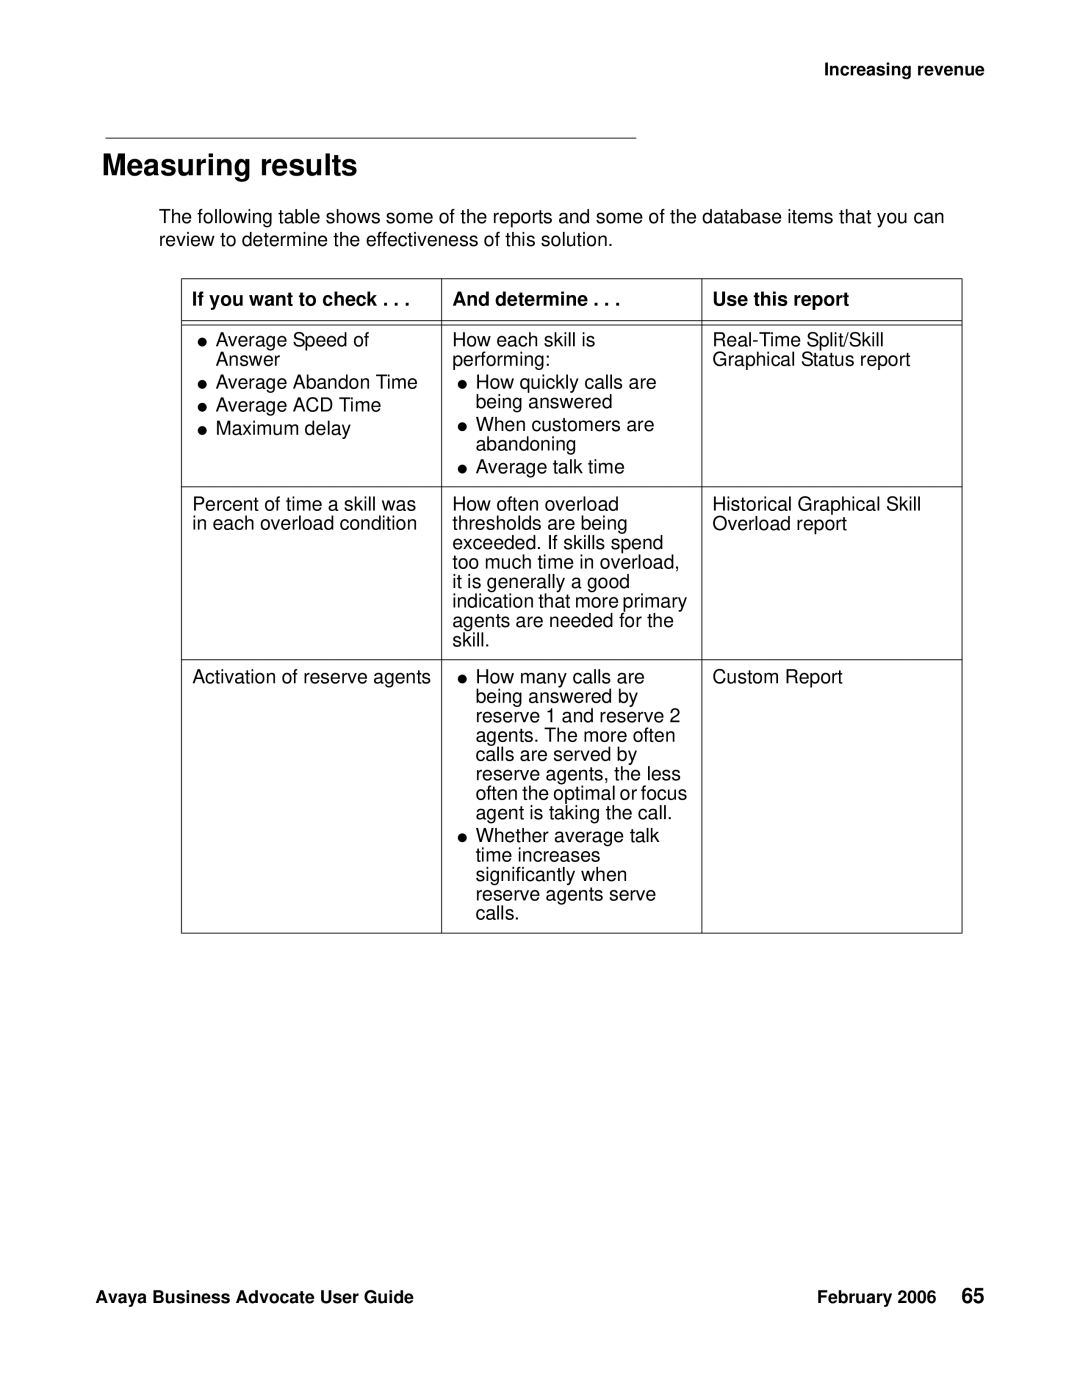
The following table shows some of the reports and some of the database items that you can review to determine the effectiveness of this solution.
If you want to check . . . | And determine . . . | Use this report |
|
|
|
|
|
|
● Average Speed of | How each skill is | |
Answer | performing: | Graphical Status report |
● Average Abandon Time | ● How quickly calls are |
|
● Average ACD Time | being answered |
|
● Maximum delay | ● When customers are |
|
| abandoning |
|
| ● Average talk time |
|
|
|
|
Percent of time a skill was | How often overload | Historical Graphical Skill |
in each overload condition | thresholds are being | Overload report |
| exceeded. If skills spend |
|
| too much time in overload, |
|
| it is generally a good |
|
| indication that more primary |
|
| agents are needed for the |
|
| skill. |
|
|
|
|
Activation of reserve agents | ● How many calls are | Custom Report |
| being answered by |
|
| reserve 1 and reserve 2 |
|
| agents. The more often |
|
| calls are served by |
|
| reserve agents, the less |
|
| often the optimal or focus |
|
| agent is taking the call. |
|
| ● Whether average talk |
|
| time increases |
|
| significantly when |
|
| reserve agents serve |
|
| calls. |
|
|
|
|
Avaya Business Advocate User Guide | February 2006 65 |