Adding customer segments
Measuring results
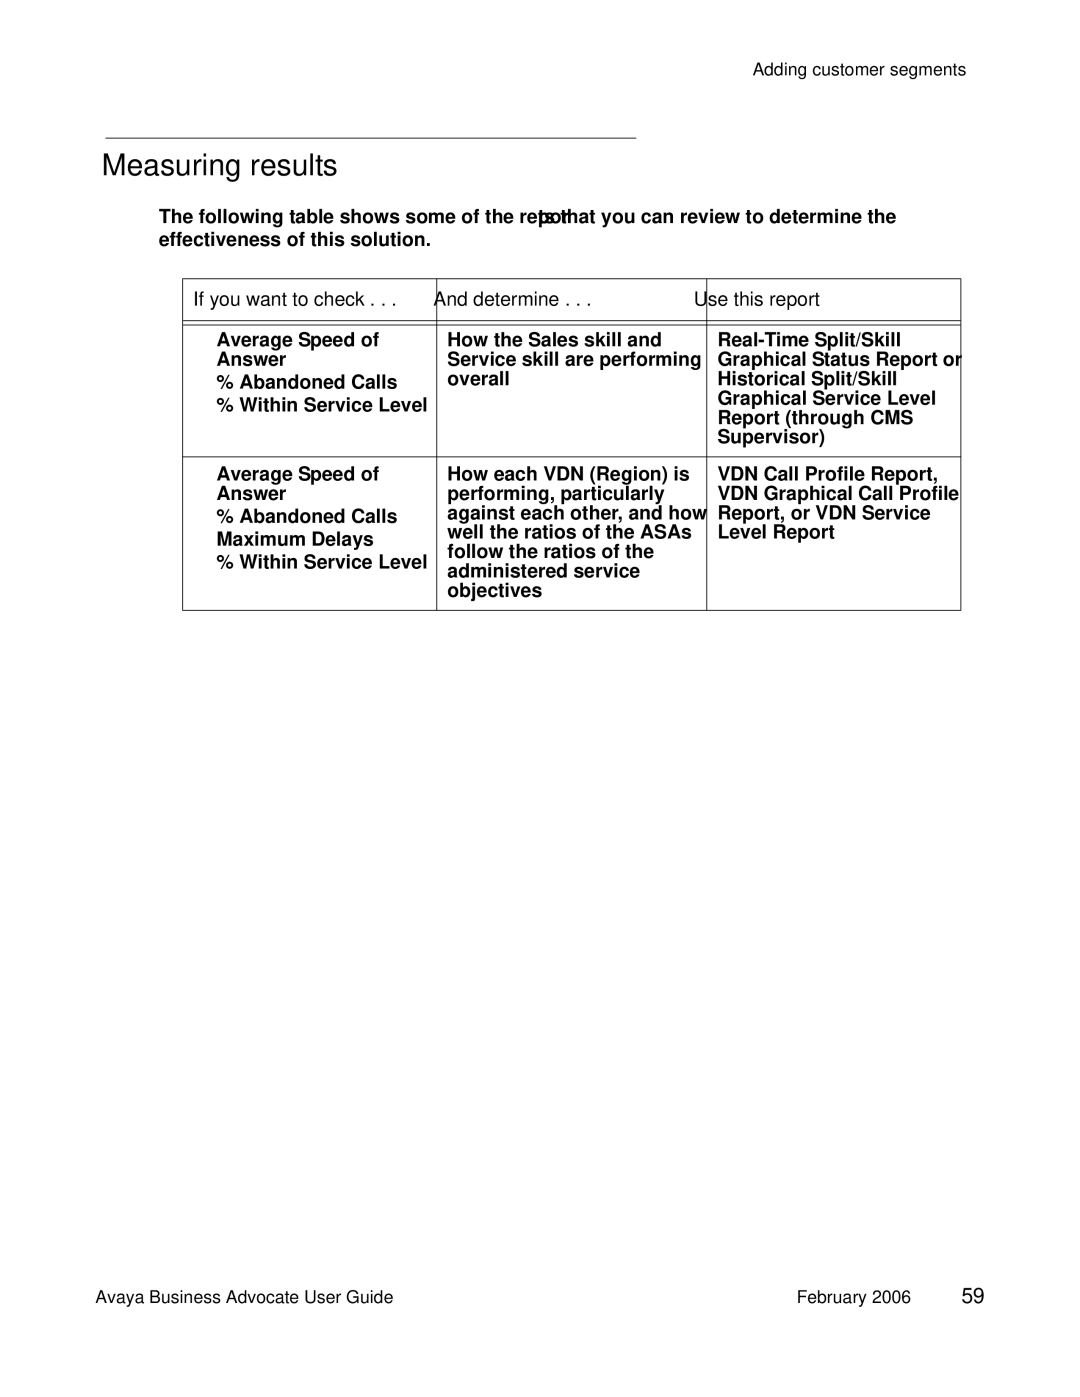
The following table shows some of the reports that you can review to determine the effectiveness of this solution.
If you want to check . . . | And determine . . . | Use this report |
|
|
|
|
|
|
● Average Speed of | How the Sales skill and | |
Answer | Service skill are performing | Graphical Status Report or |
● % Abandoned Calls | overall | Historical Split/Skill |
● % Within Service Level |
| Graphical Service Level |
| Report (through CMS | |
|
| |
|
| Supervisor) |
|
|
|
● Average Speed of | How each VDN (Region) is | VDN Call Profile Report, |
Answer | performing, particularly | VDN Graphical Call Profile |
● % Abandoned Calls | against each other, and how | Report, or VDN Service |
● Maximum Delays | well the ratios of the ASAs | Level Report |
follow the ratios of the |
| |
● % Within Service Level |
| |
administered service |
| |
| objectives |
|
|
|
|
Avaya Business Advocate User Guide | February 2006 59 |
