Americas Headquarters
Text Part Number OL-18259-01
Page
N T E N T S
Iii
LEDs
Using Power Strips with a Rack-Mount Installation
Reinstalling the Modules
Troubleshooting Methods
Vii
Removing and Replacing a Network Line Card
Viii
Frequency Allocation C-1
OL-18259-01
Revision History Date Reason
Purpose
Audience
Chapter Title Description
Document Organization
Related Documentation
Xii
Conventions
Xiii
Safety Information Referral Warning
Xiv
Aviso Instruções Importantes DE Segurança
Warnung Wichtige Sicherheitshinweise
Avvertenza Importanti Istruzioni Sulla Sicurezza
Spara Dessa Anvisningar
Xvi
GEM Disse Anvisninger
Xvii
Xviii
Terms and Acronyms
Xix
Preface
Obtaining Documentation and Submitting a Service Request
Xxi
Xxii
Cisco uBR10012 Universal Broadband Router Overview
Cisco uBR10012 Router Features
Comparisons with Other Cisco Cmts Platforms
Cisco uBR10012 Router Functional Overview
Upstream Data Path
Downstream Data Path
Baud Rate
Cisco uBR10012 Router and Cisco IOS Software
Docsis and EuroDOCSIS Data Rates and Modulation Schemes
Throughput Bit Rate Overhead
Upstream Channel Width Bit/symbol Symbol/sec Mb/sec
MHz Bit/symbol MSym/sec Mb/sec
Nebs Level 3 Compliance
Cisco uBR10012 Router
56300
Power Miswire
3shows the rear of a fully-loaded Cisco uBR10012 router
Cisco uBR10012 Router Slot Numbering
US6
Cisco uBR10012 Chassis Slot Numbering-Front View
Status Description
Fan Assembly Module
Cisco uBR10012 Universal Broadband Router Modules
Fan Assembly Cable
LCD Module
PRE Modules and PRE1 Modules
Performance Routing Engine
LCD Cable
PRE2 Modules
PRE4 Modules
Redundant PRE Modules
PRE Module Description
Connector Ports
PC Media Card Slots
LCD Screens
PRE LED Indicators and Buttons
LEDs/Switch Status Description
PRE Module Disposal
DC Power Entry Modules
SIP and SPA Compatibility
Bits
Alarm connector
Fault
AC Power Entry Modules
Power
Miswire
AC PEM LEDs
14shows the front panel of the AC PEM
Description Product Order Number
Power Supply Cables
Airflow
Power Fault
Timing, Communication, and Control Plus Card
16 TCC+ Card Faceplate
Color/Status Description
Cable Interface Line Cards
TCC+ Card LEDs
Cisco uBR10-LCP2-MC16x C, E, S Cable Interface Line Cards
Cisco MC16C cable line card
QPSK, 16 QAM
+42 dBmV +/- 2dB
Color Description
Enable
Cisco uBR10-LCP2-MC16xLEDs
MGR ACT
Cisco uBR10-LCP2-MC28C Cable Interface Line Card
22 Cisco uBR10-LCP2-MC28C Faceplate
Cisco uBR-MC5X20S/U Cable Interface Card
Cisco uBR10-LCP2-MC28C LEDs
Section on
Network Uplink Cards
Cisco Single Port Gigabit Ethernet Line Card
Wavelength Core Size Modal Bandwidth Cable Distance
Gbic Specifications
Cisco Gigabit Ethernet Line Card LEDs
Fiber Type Microns MHz/km Feet/meters
ESR-GBIC-LH
Cisco Half-Height Gigabit Ethernet Line Card
MMF1
SMF
LEDs
SFP-GE-S
Modal Wavelength Core Size Bandwidth
Fiber Type Microns MHz*km Cable Distance
SFP-GE-L
Cisco OC-12 POS Line Card
Fiber Type Wavelength, nm Core Size, microns Cable Distance
Carrier
Cisco uBR10-SRP-OC12SML DPT WAN Line Card
Cisco OC-12 POS Line Card LEDs
28shows the Cisco uBR10-SRP-OC12SML DPT WAN line card
RX CARRIER-B
Enabled
Cisco uBR10-SRP-OC12SMLDPT WAN Line Card LEDs
RX CARRIER-A
Fiber Type Wavelength, nm Core Size, microns Cable Distance
Cisco uBR10012 OC-48 DPT/POS Interface Module
Attenuation
POS
SRP
Wrap
Optical Connectors and Cables
Sync
Pass Thru
Field-Replaceable Unit Product Order Number
Cisco uBR10012 Router FRU Resources
FRU Modules and Order Numbers
Cable Interface Line Cards
FRU Documentation
Network Line Cards
URL
Preparing for Installation
Safety
Preventing Electrostatic Discharge Damage
Chassis-Lifting Guidelines
Electrical Safety
Site Requirements
Environmental Site Requirements
Temperature and Humidity Requirements
Specification Minimum Maximum
Power Guidelines
Power Connection Guidelines for DC-Powered Systems
Interference Considerations
Plant Wiring Guidelines
Cabling Guidelines
Ethernet and Fast Ethernet Connections
Fiber-Optic Connections
Rack-Mounting Considerations
Mounting Guidelines
Using Power Strips with a Rack-Mount Installation
Typical 19-Inch Equipment Rack Posts and Mounting Strips
OL-18259-01
Installing the Cisco uBR10012 Router
Installation Methods
Preparing the Cisco uBR10012 Router for Rack-Mounting
General Rack Installation Guidelines
Removing the Power Modules, Fan Assembly, and Line Cards
Removing the Front Cover
Removing the Cisco uBR10012 Chassis Front Cover
Removing the DC Power Entry Modules
Turning Off a DC PEM
Removing the AC Power Entry Module
Power Miswire Fault
AC Power Cord and AC On/Off Switch Locations on the AC PEM
Removing the Fan Assembly
Removing the AC PEM
Removing the Fan Assembly Module
Removing the Cable Interface Line Cards and Uplink Cards
Captive Screws and Ejector Levers
ESD-preventive Strap
Removing a Half-Height Gigabit Ethernet Line Card
Captive screw
10 Opening the Ejector Levers
Removing the Slot Splitter
11 Captive Screw Locations
12 Removing the Slot Splitter
Attaching the Mounting Brackets
13 Mounting Brackets for the Cisco uBR10012 Router
14 Bracket Location for Flush Front-Mounting the Chassis
15 Bracket Location for Flush Rear-Mounting the Chassis
16 Bracket Location for Offset Front-Mounting the Chassis
Installing the Cable Management Brackets Optional
17 Installing the Optional Cable Management Brackets
Mounting the Chassis in the Rack
Quantity Description Comments
Installing the Cisco uBR10012 Chassis in the Rack
Recommended Tools and Supplies
OL-18259-01
Connecting the Chassis to Ground
18 Attaching the Chassis to the Equipment Rack
Attaching the Grounding Cable
19 Attaching Grounding Wire to the Grounding Lug
Connecting DC Power to the Cisco uBR10012 Router
Connecting the Cisco uBR10012 Chassis to a DC Power Source
21 Stripping Insulation
22 Location of the DC Power Connectors and Alarm Connections
Connecting Alarm Indicators
23 DC Power Terminal Block Connections
Connecting the Alarm Indicators
24 Stripping Insulation
25 Alarm Terminal Block Connections
Description Comments
Reinstalling the Modules
Reinstalling the Fan Assembly Module
Reinstalling the DC Power Entry Modules
27 Installing a DC PEM
Reinstalling the AC Power Entry Modules
28 AC PEM Standby Position and AC Plug Location
29 Replacing the AC PEM
30 Routing the AC Cables
Reinstalling the Line Cards and Uplink Cards
SD-preventive Strap
32 Closing the Ejector Levers
Installing the Slot Splitter
33 Hhge Line Card Locations
34 Inserting the Slot Splitter
35 Captive Screw Locations
Installing the Half-Height Gigabit Ethernet Line Card
Ejector Ejector lever
37 Closing the Ejector Levers
38 Captive Screw Locations
Connecting the Console Port and Auxiliary Port
Connecting to the Console Port
39 Console Port Connection on the PRE Module
Connecting to the Auxiliary Port
41 Auxiliary Port Connection on the PRE Module
Ethernet Network Management Cable Connections
Connecting Network Management Cables
Connecting to a 10Base-T Ethernet Network
Connecting to a 100Base-T Ethernet Network
42 Connecting 10Base-T to an Ethernet Port
43 Connecting 100Base-T to Ethernet Port
Cable Interface Line Card Connections
Network Uplink Cable Connections
Connecting a Single-Port Gigabit Ethernet Line Card
Remove the protective plug from the Gbic by pulling it off
Attach the fiber optic cable to the Gbic port Figure
Replacing the Front Cover
IE AR LO IER
47 Attaching the Cover to the Chassis
Powering On the System
48 Cisco uBR10012 Router DC PEM Power Switches On Position
Configuring the Cisco uBR10012 Router at Startup
Startup Display
Configuring the System Using System Configuration Dialog
Basic Configuration Using the Setup Facility
System Configuration Dialog
Setting Up the Interface
OK?
Basic Configuration in Global Configuration Mode
Routerconfig #interface FastEthernet0/0/0
Formatting PC Media Cards
Router# format disk0
Troubleshooting the Installation
Problem Solving Using a Subsystems Approach
Troubleshooting Methods
Troubleshooting Installation Problems
Before You Call for Technical Assistance
General Troubleshooting Tips
Symptom Steps to Take
Troubleshooting Ethernet Connections
Ethernet Connections section on
Troubleshooting the Console Port Serial Connection
Troubleshooting the Installation
Identifying Startup Problems
Troubleshooting the Power Subsystem
Troubleshooting the AC Power Subsystem
Troubleshooting the DC Power Subsystem
Troubleshooting the AC-Input Power Shelf
Troubleshooting the Processor Subsystem
Troubleshooting the Cooling Subsystem
Troubleshooting the Line Cards
Queued messages
Troubleshooting the Hhge Installation
Symptom Possible Cause Corrective Action
Symptom Possible Cause Corrective Action
Maintaining the Cisco uBR10012 Router
Required Maintenance Tools
Shutting Down the System
Removing and Replacing the Front Cover
Removing the Front Cover
Replacing the Front Cover
Attaching the Cover to the Chassis
Replacing the Air Filter
Removing and Inserting the Air Filter
Removing and Replacing the Fan Assembly Module
Air Filter Inserted into the Front Cover
56293
Removing and Replacing DC Power Entry Modules
Removing the DC PEM
Turning a DC PEM Off
Removing a DC PEM
DC Power Connection
Replacing the DC PEM
Installing a DC PEM
10 Setting the DC Power Switch to the On Position
Replacing Both DC PEMs
11 Turning Off the DC PEM
12 Removing a DC PEM
13 DC Power Connection Location
Use copper conductors only. Statement
14 Installing a DC PEM
Removing the PEM from the Chassis
15 Turning the Second DC PEM Off
Attaching the Alarm Wires
16 Stripping Insulation
Installing the PEM in the Chassis
17 Alarm Terminal Block Connections
Removing and Replacing AC PEM Modules
Replacing a Redundant AC PEM
18 Turning an AC PEM Off
19 Removing the AC PEM
20 Installing the AC PEM
21 Routing the AC Power Cables
22 Setting AC Power Switch to the on Position
Replacing Both AC PEMs
23 Turning the AC PEM Off
Removing and Replacing the PRE Module
Removing the PRE Module
25 Loosening the Captive Screws
26 Opening the Ejector Levers
27 Removing the PRE Module from the Chassis
Replacing the PRE Module
56427
29 Closing the Ejector Levers
Removing and Installing a PC Media Card
30 PC Media Card Cover Captive Screws
31 Removing the PC Media Card
33 TCC+ Card Captive Screws
34 Removing the TCC+ card
Connect the clock cables to the TCC+ card
Removing and Replacing a Network Line Card
Removing the Network Line Card
36 Loosening the Captive Screws
37 Opening the Ejector Levers
38 Removing the Network Line Card
Installing the Network Line Card
39 Inserting the Network Line Card
40 Closing the Ejector Levers
Maintaining the Cisco uBR10012 Router
41 Captive Screw Locations
42 Opening the Ejector Levers
43 Captive Screw Locations
44 Removing the Slot Splitter
Installing the Slot Splitter
45 Inserting the Slot Splitter
46 Captive Screw Locations
47 Inserting the Line Card
48 Closing the Ejector Levers
49 Captive Screw Locations
Removing an SFP Module
Removing and Replacing an SFP Module
Types of SFP Modules
51 Disconnecting the LC-type Fiber-Optic Cable
Inserting an SFP Module
53 Inserting the SFP Module
Upgrading to a Half-Height Gigabit Ethernet Line Card
Removing and Replacing a Cable Interface Line Card
Removing the Cable Interface Line Card
54 Captive Screws, Ejector Levers
55 Removing the Cable Interface Line Card
Installing a Cable Interface Line Card
56 Inserting the Cable Interface Line Card
57 Closing the Ejector Levers
Removing the Cable Interface Line Card from the Adapter Card
58 Cisco uBR10-LCP2-MC28C Cable Interface Line Card
60 Removing the Cisco MC28C Line Card from the Adapter Card
Installing a Cable Interface Line Card in the Adapter Card
Description Specifications
Cisco uBR10012 Chassis and Chassis Components
PEM
AC PEM
UBR10-PWR-AC-EXT=
PRE
Mtbf
Description Specifications
Network Uplink Cards and Cable Interface Line Cards
Gigabit Ethernet Converter Gbic Types
USB-SRP-OC12SML, USB-SRP-OC12SML=
Mtbf
UBR10-LCP2-MC16C, UBR10-LCP2-MC16C=
UBR10-LCP2-MC28C, UBR10-LCP2-MC28C=
UBR10-LCP2-MC16E, UBR10-LCP2-MC16E=
UBR10-LCP2-MC16S, UBR10-LCP2-MC16S=
Description Specifications
OL-18259-01
Cable Specifications
Coaxial Cables
How to Identify an RJ-45 Rollover Cable
Console and Auxiliary Port Cables and Pinouts
Console Port Cables and Pinouts
Figure B-2
Fast Ethernet Port Cables and Pinouts
Auxiliary Port Cables and Pinouts
How to Identify an RJ-45 Crossover Cable
Pin 1 Pin
How to Identify an RJ-45 Straight-Through Cable
RJ-45 Pin Description
Connecting a Cable to an RJ-45 Connector
Tools
Fiber-Optic Cables and Connectors
Figure B-8 Installing Cable in an RJ45 Connector
Figure B-9 Duplex SC Cable Connector
OL-18259-01
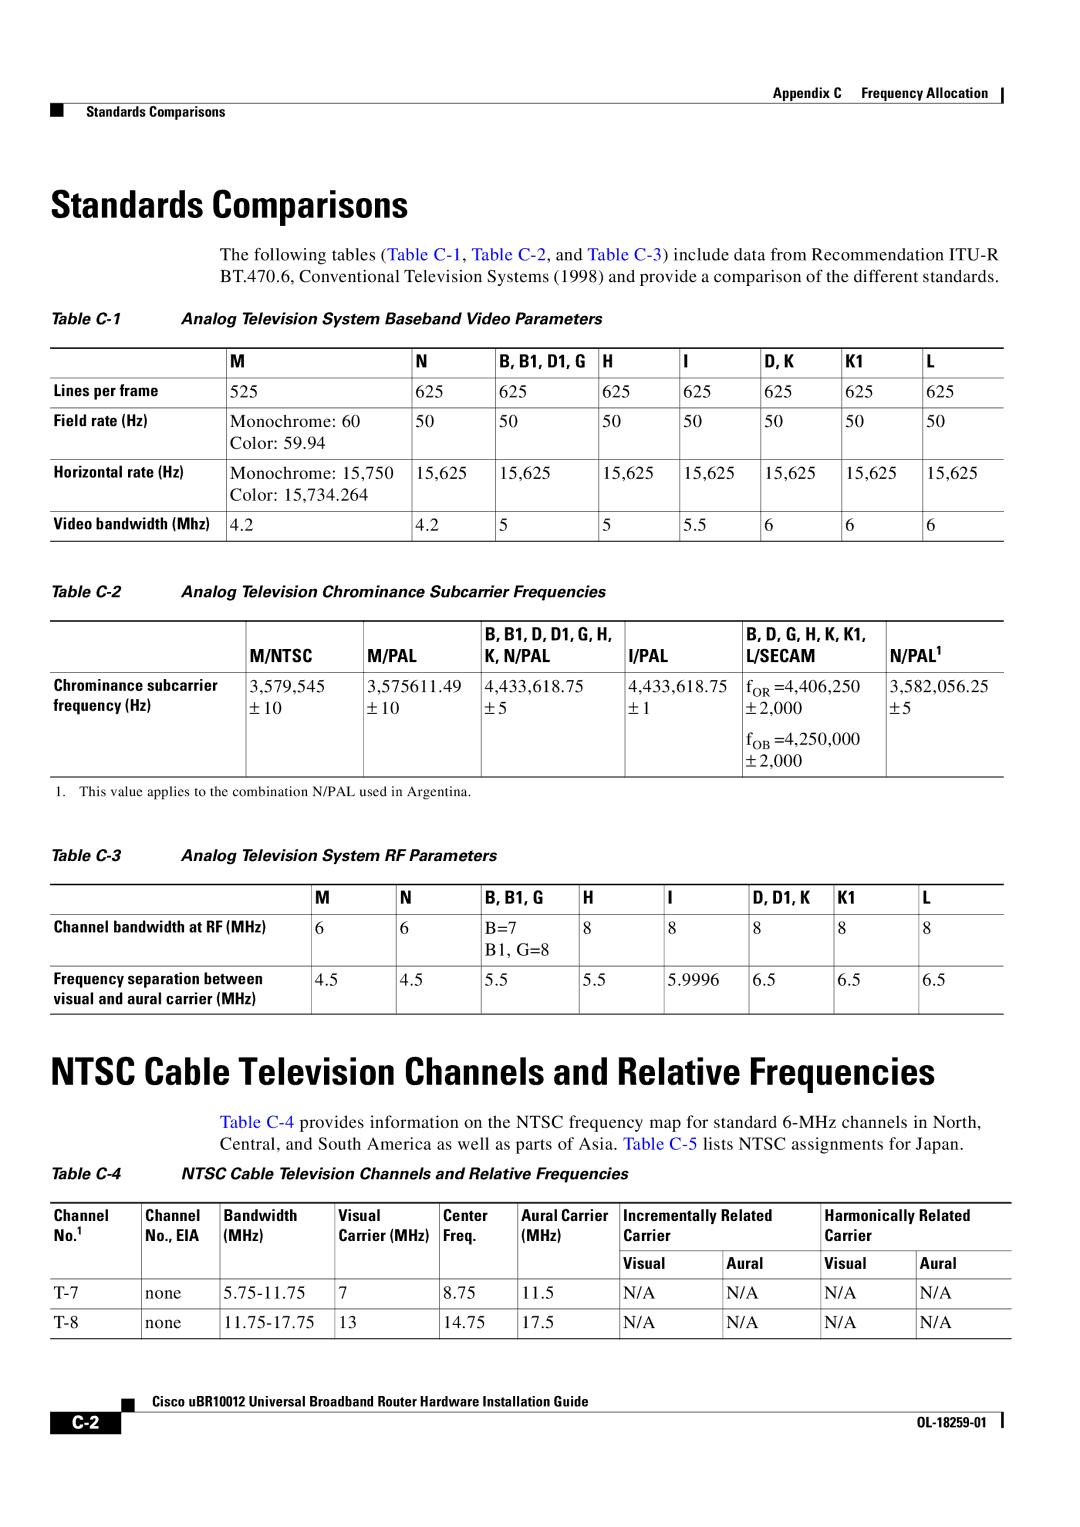
Frequency Allocation
Standards Comparisons
B1, G D1, K
TV-IF
Table C-4
OL-18259-01
Table C-4
Table C-4
Table C-4
Ntsc M Cable Television Channel Frequencies for Japan
Ntsc M Cable Television Channel Frequencies for Japan
Catv
Bandwidth Visual Carrier Center Aural Carrier
MHz Frequency Usage
Channel
Bandwidth Visual Carrier Center Aural Carrier
PAL/SECAM Cable Television Channels and Relative Frequencies
Bandwidth Visual Carrier Aural Carrier
PAL/SECAM Cable Television Channels and Relative Frequencies
Bandwidth Visual Carrier Aural Carrier
Channel Bandwidth Visual Carrier Aural Carrier Number MHz
DS8
DS6
DS7
DS9
Channel
Table C-8
North American Channel Plans
Manufacturer1 Web Site or Phone Number Products/Model
Manufacturer Web Site or Phone Number Products/Model
Agilent Agilent 89411A
European Channel Plans
Cisco uBR10-MC5X20S/U Cable Kits and Tools
Symbols
GL-1
See also Critical alarm, Major alarm, and Minor alarm
GL-2
GL-3
GL-4
Also Fast Ethernet, Gigabit Ethernet, Ieee
GL-5
GL-6
GL-7
Refers to the format also known as M23
GL-8
GL-9
See Fiber-optic cable
GL-10
Also PXF Network Processors
GL-11
GL-12
GL-13
Tftp
See Clear channel DS3
GL-14
GL-15
GL-16
Numerics
IN-1
IN-2
DC PEM
IN-3
OC-12 POS
IN-4
IN-5
EMI
ESD
Gbic
Ntsc Ntsc M
HFC B-1
IN-6
Fan assembly module Fan failure Fault
LCD
IN-8
Ntsc
PAL C-1
PRE2
IN-9
Secam
IN-10
Ground connection and disconnection
IN-11
IN-12