Chapter 8 Reporting Tool
Using the Reporting Tool
The Reporting tool is a
To invoke the Reporting tool
1.Use the Web browser of your choice to connect to the IP address of the NetScaler (for example, http://10.102.29.170/).
The Web Logon screen appears.
2.In the User Name text box, type the user name assigned to the NetScaler.
3.In the Password text box, type the password.
4.In the Start in
5.Click Login.
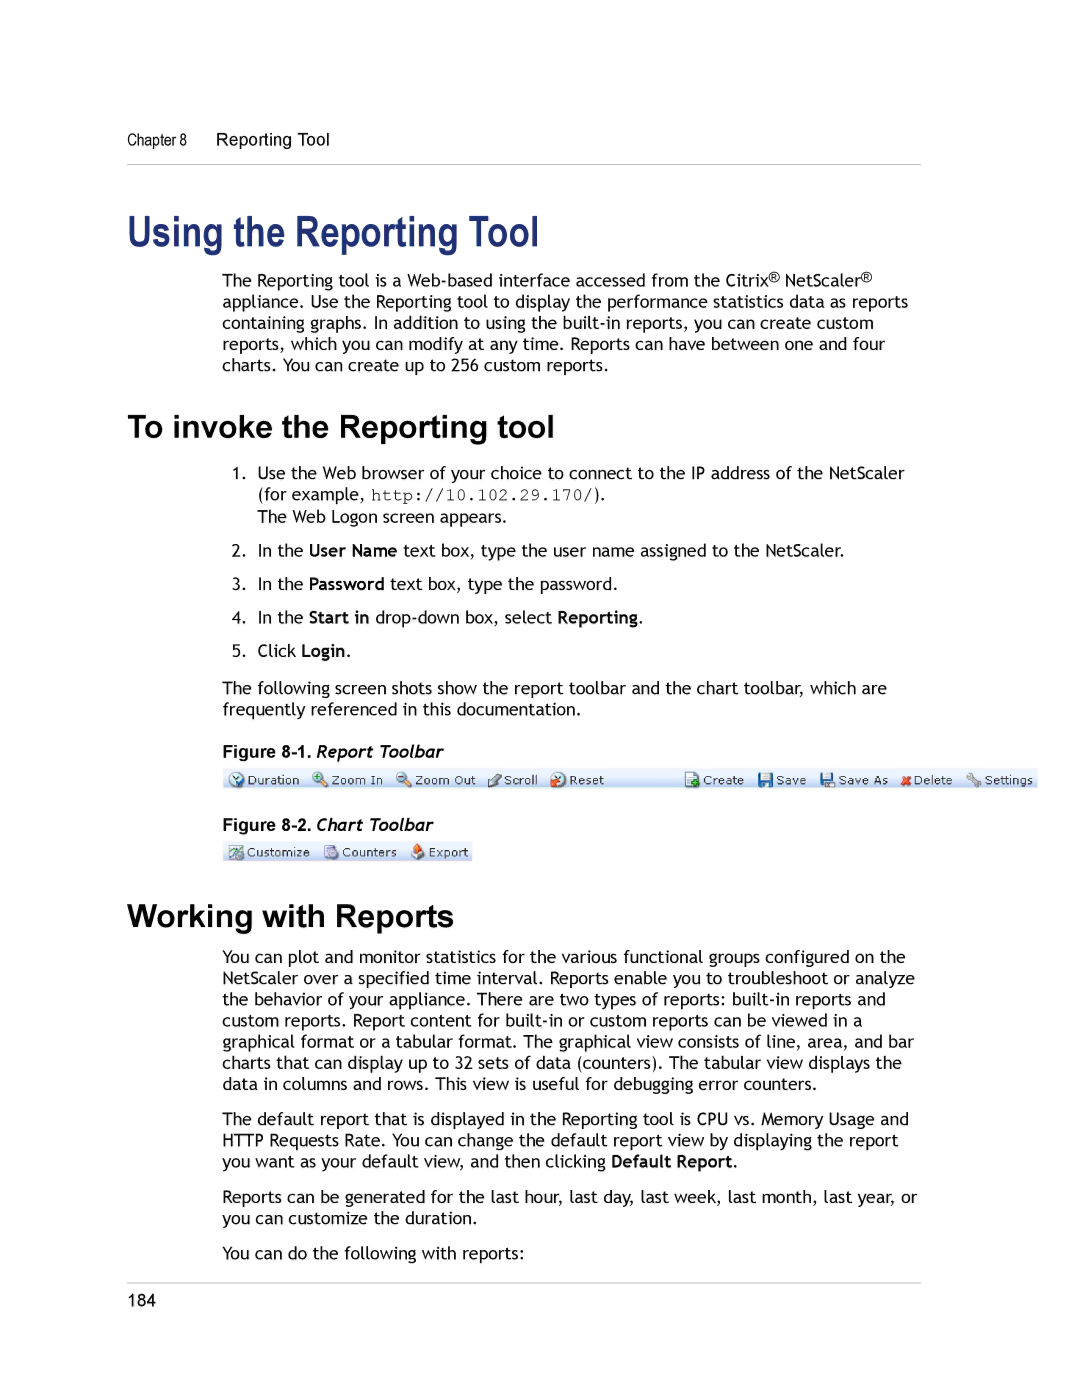
The following screen shots show the report toolbar and the chart toolbar, which are frequently referenced in this documentation.
Figure 8-1. Report Toolbar
Figure 8-2. Chart Toolbar
Working with Reports
You can plot and monitor statistics for the various functional groups configured on the NetScaler over a specified time interval. Reports enable you to troubleshoot or analyze the behavior of your appliance. There are two types of reports:
The default report that is displayed in the Reporting tool is CPU vs. Memory Usage and HTTP Requests Rate. You can change the default report view by displaying the report you want as your default view, and then clicking Default Report.
Reports can be generated for the last hour, last day, last week, last month, last year, or you can customize the duration.
You can do the following with reports:
184