D-Link DHS-3224V Switch User’s Guide
Time Interval | Select the desired setting between 1s and 60s, where “s” stands for | |
seconds. The default value is one second. | ||
| ||
|
| |
Record Number | Select number of times the Switch will be polled between 20 and 200. The | |
default value is 20. | ||
| ||
|
| |
Bytes | Counts the number of bytes successfully sent from the port. | |
|
| |
Packets | Counts the number of packets successfully sent on the port. | |
|
| |
Show/Hide | Check whether or not to display Bytes and Packets. | |
|
| |
Clear | Clicking this button clears all statistics counters on this window. | |
|
| |
View Table | Clicking this button instructs the Switch to display a table rather than a line | |
graph. | ||
| ||
|
| |
View Line Chart | Clicking this button instructs the Switch to display a line graph rather than a | |
table. | ||
| ||
|
|
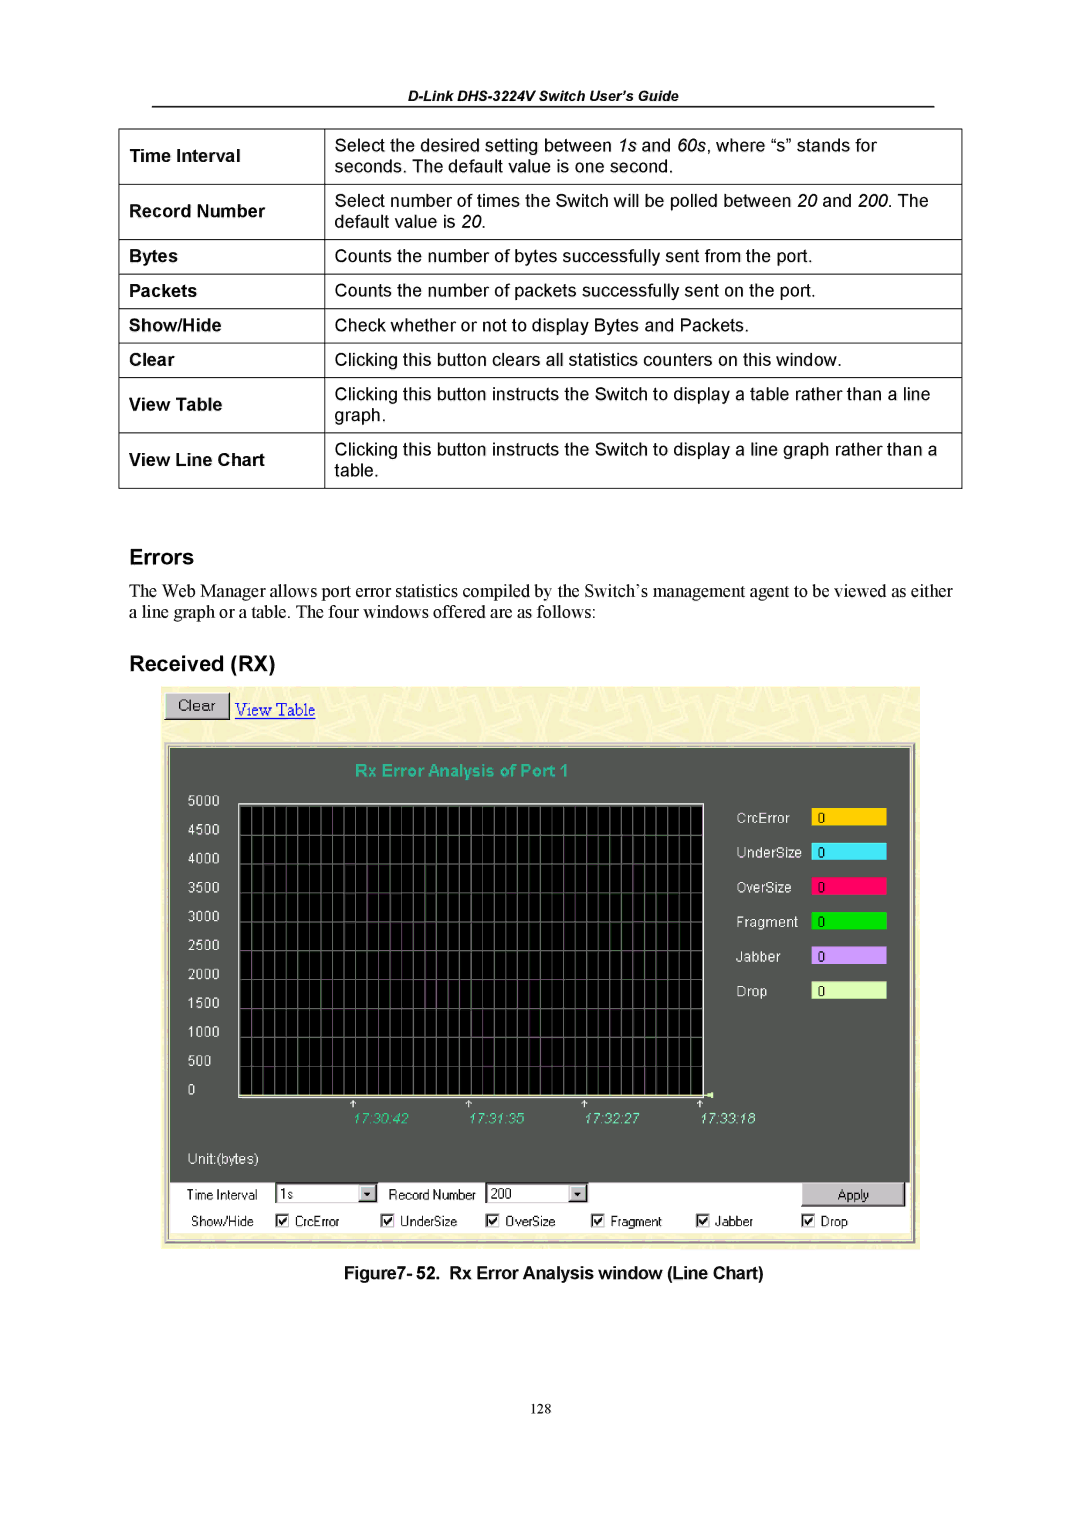
Errors
The Web Manager allows port error statistics compiled by the Switch’s management agent to be viewed as either a line graph or a table. The four windows offered are as follows:
Received (RX)
Figure7- 52. Rx Error Analysis window (Line Chart)
128