D-Link DHS-3224V Switch User’s Guide
Monitoring
This category includes: Port Utilization, Packets (Received (RX), UMB_cast (RX), and Transmitted (TX)), Errors (Received (RX) and Transmitted (TX)), Size (Received (RX)), MAC Address, IGMP Snooping and Port Access Control, as well secondary screens.
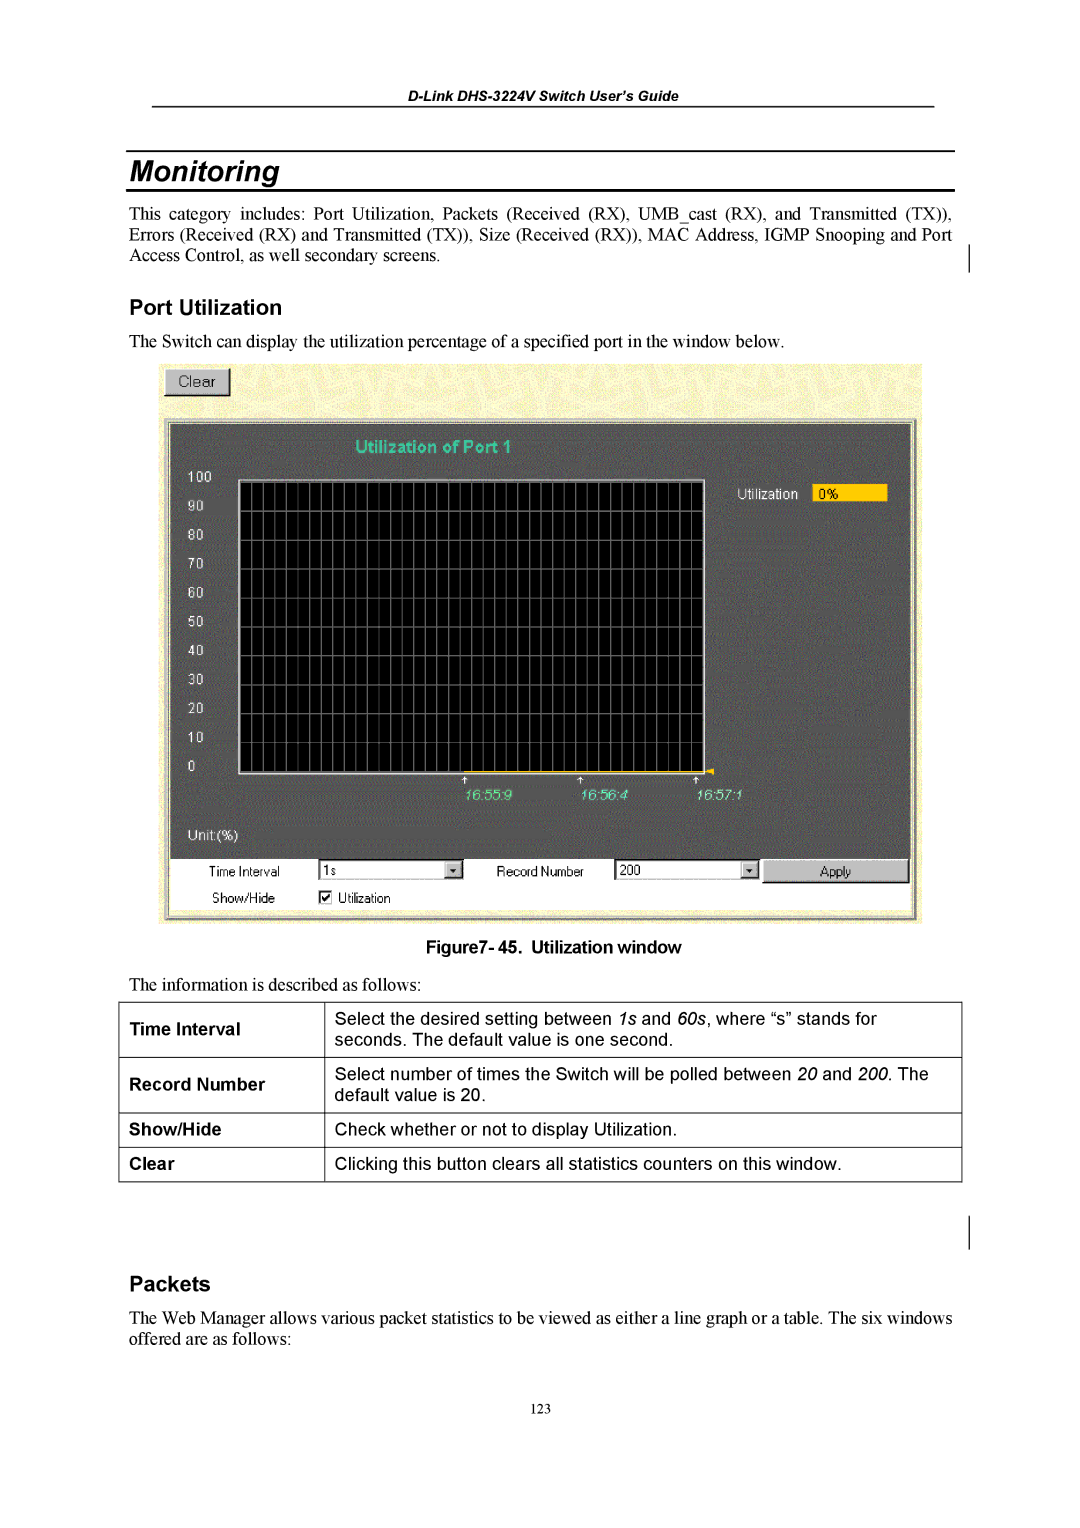
Port Utilization
The Switch can display the utilization percentage of a specified port in the window below.
Figure7- 45. Utilization window
The information is described as follows:
Time Interval | Select the desired setting between 1s and 60s, where “s” stands for | |
seconds. The default value is one second. | ||
| ||
|
| |
Record Number | Select number of times the Switch will be polled between 20 and 200. The | |
default value is 20. | ||
| ||
|
| |
Show/Hide | Check whether or not to display Utilization. | |
|
| |
Clear | Clicking this button clears all statistics counters on this window. | |
|
|
Packets
The Web Manager allows various packet statistics to be viewed as either a line graph or a table. The six windows offered are as follows:
123