RiverMaster Administrator’s Guide
Office
Table of Contents
Configuring an ANG-3000/7000
Setting Up Aurorean Services
Adding POPs for Corporate ISPs 114
Managing Users & Groups
Generating Reports
Index
About This Guide
Contents of the Guide
About This Guide
Related Documents
Conventions Used in this Guide
Xii
Hardware Requirements
System Requirements
Upgrading a Previous Release
Installing the Application
Installation Steps
Software Requirements
Installing the Application
When the Welcome window appears, click Next to continue
Starting the Application for the First Time
To start RiverMaster, perform the following steps
First-Time Setup Information
Select APS Window
Do one of the following
RiverMaster Login Window
RiverMaster Main Interface
Removing RiverMaster Files
Removing RiverMaster Files
Locate the RiverMaster program folder
Default location for this folder is C\Program Files\
Delete the RiverMaster folder Restart your computer
RiverMaster Overview
Getting Started with RiverMaster
Curre
Logging into RiverMaster
Logging into RiverMaster
Logging into RiverMaster
Checking Server Status
Problem Summary & Users Logged
Checking Server Status
Aurorean Network Gateway Status Information
Aurorean Network Gateway Statistics
Aurorean Network Gateway Statistics
Aurorean Policy Server Statistics
Service Function If Stopped
Aurorean Policy Server Services
FTP
Aurorean Policy Server Services
Setting Up a Aurorean Virtual Network the First Time
Setting Up a Aurorean Virtual Network the First Time
Add user accounts to each group as described in Chapter
Setting Up a Aurorean Virtual Network the First Time
Page
Configuring an ANG-3000/7000
Before You Begin
Configuration Pullout
Before You Begin
Allocating IP/IPX Addresses to Remote Clients
Before You Begin
Remote Client Virtual Subnet Usage
Configuring an ANG-3000/7000
Intelligent Client Routing
Virtual Subnets for Site-to-Site and Remote Access Tunnels
Intelligent Client Routing Enabled
Intelligent Client Routing Disabled
Gateway
NAT Server
Aurorean
Network
Site-to-Site Tunnels
Site-to-Site Configuration
AutoLink Recovery
Primary Aurorean System
General Aurorean Network Gateway Settings
General Aurorean Network Gateway Settings
General Aurorean Network Gateway Settings
DNS server addresses tab page appears as shown in Figure
Click the DNS tab
Wins Server Addresses
Click the Wins tab
NAT Server Address
Click the NAT tab
Primary addresses cannot be modified in this window
Viewing Aurorean Alternate Address Information
Click Apply to save your changes
Aurorean Alternate Address Info window appears as shown
Tunnel Protocols
Tunnel Protocols
Tunnel Protocols window appears as shown in Figure
Tunnel Protocol General Settings
Tunnel Protocol Authentication Settings
Click the Authentication tab
Parameter Explanation
Click the Encryption tab Do one of the following
Tunnel Protocol Encryption Settings
Tunnel Parameter Explanation Protocol
Click the Compression tab
Tunnel Protocol Compression Settings
Enable or disable Mppc as required
Virtual Subnetting
Virtual Subnetting
IP Subnetting
Sample IP subnet window is shown in Figure
Click Add
Click Remove to delete any configured virtual subnets
Add An IP Virtual Subnet window appears as seen in Figure
Sample IPX virtual networks window is shown in Figure
IPX Virtual Networks
IPX Subnet Configuration for Remote Clients
Routing
Routing
RIP Configuration window should appear as shown in Figure
Setting Routing Protocol Parameters
RIP Routing Protocol Configuration
Parameter Meaning Fixed Value
Repeat and for each gateway required Do one of the following
Ospf Routing Protocol Configuration
Ospf Configuration window appears as shown in Figure
Routing Interfaces
Adding or Removing a Routing Protocol for an Interface
Adding a Routing Protocol
Choose the version of RIP to use on this interface
RIP Interface Configuration window appears as shown
Do one of the following
Ospf Interface Configuration window appears as shown
To enable Ospf on an interface, perform the following steps
Static parameter tab page is displayed as shown in Figure
Do one of the following
Routing
Click Add
Remote Server Display
Adding a Remote Server
Add Remote Server window appears as shown in Figure
Click Add Remote Server
Add Remote Tunnel window appears as shown in Figure
Choose the tunneling protocol IPSec or Pptp Click Add
Adding a Remote Server
Changing Server and Tunnel Properties
Select Enabled or Disabled in the Enabled State field
Remote Tunnel Properties window appears as shown in Figure
Adding a Remote Server
Page
Setting Up Aurorean Services
Radius Authentication Servers
Authorization Plug-in Options
Plug-in Planning
Problem Notification
Private/Public Keys for IPSec Authentication
Trace Levels
Trace Messages Display
Adding an Authorization Plug-In
Shows the Configuration pullout
Enterasys Authentication
Click here to update the plug-in
Optionally, specify a value in the Num Threads field
Radius Authorization
Adding an Authorization Plug-In Chapter
Optionally, specify a value in the Num Threads field
Server Type Recommended Value
Create New Plug-in window will appear as shown in Figure
SecurID Authorization
Adding an Authorization Plug-In Chapter
Click Create
Specify SecurID Configuration File Window
Chapter
Generating Private/Public Keys
Chapter
Creating a Mailing List
Using the Notification Service to Send E-Mail
Chapter
Adding an Address to a Mailing List
Using the Notification Service to Send E-Mail Chapter
ANG Tunnel Management Service Window
Setting Trace Levels
Backing Up the Database
Click Set to enable the Trace Level
Starting a Database Backup Click Start on Backup Database
Click on Indus River Access
Backing Up the Database
Window similar to will appear
100
101
Controlling Remote User Dialing & Access
102
TollSaver Database
103
Corporate Dial-Up Access
104
Corporate
105
Creating POP Packages
106
Creating POP Packages
107
Build Completed Window
108
Adding Corporate ISPs
109
ISP Properties display will appear as show in Figure
Click the ISP Properties tab
110
Script files are not uploaded without the .SCP extension
Select the Access Method as follows
111
112
Adding Corporate ISPs
113
Adding POPs for Corporate ISPs
Adding POPs for Corporate ISPs
114
115
Pull-down options appear as shown in below
116
This field is currently not implemented
117
Script window appears as shown in Figure
Page
119
Managing Users & Groups
120
Manage Users & Groups Pullout
121
Group Policies
122
Aurorean Client Installation Kits
123
Contents of a Aurorean Client Installation Kit
124
Client Synchronization
125
126
Creating a New Group
Creating a New Group
Group Notices
Open the Manage Users and Groups pullout
128
Manage Users and Groups Pullout Group View
129
130
Policy Explanation
131
Password Policies
132
Credit Card Policies
133
Tunnel Policies
Sample User view is shown in Figure
Adding Users to a Group
134
135
Corporate User Name field, type a name for the user
Department field automatically defaults to the group name
Password field, type a unique password
136
137
Modifying User & Group Information
138
Removing Users & Groups
139
Creating an Aurorean Client Installation Kit
Creating an Aurorean Client Installation Kit
Sample Group view is shown in Figure
140
Build Client Install Kit Window
Set the Install Kit Options as follows
Default Aurorean installation kit file name is
141
142
Advanced Kit Options Window
143
144
Kit Complete Message
Controlling Client Synchronization
Controlling Client Synchronization
145
146
Viewing Group Policies
Building Core Data Files
Open the Configuration pullout Click the Update tab
147
148
Build Core Data Files Display
149
Uploading Software Synchronization Files
150
Upload Software Synchronization Files Display
151
Click Upload to copy the file you chose onto the APS
152
Setting Up Group Notices
Setting Up Group Notices
Group Notice display appears as shown in Figure
153
Chapter Managing Users & Groups
Group pull-down screen appears as shown in Figure
Click the arrow in the Group field and select a group
154
Message you write is limited to 256 characters. See Figure
Write your notice in the text box
155
Page
Current Message Activity
Monitoring System Activity
157
Monitoring System Activity
To view message activity, perform the following steps
Open the View System Activity pullout
Sample message activity view is shown in Figure
159
System Activity Display
160
161
Message ID Message Type Detailed Description
162
Text
163
Tunnelid
164
Advanced Message Viewer
165
Advanced Message View Setup Example
166
Message Type Explanation
167
168
Advanced Message Viewer Results Example
169
Printing Messages
RiverMaster Options window displays as shown in Figure
RiverMaster Options
170
171
RiverMaster Options Window
172
173
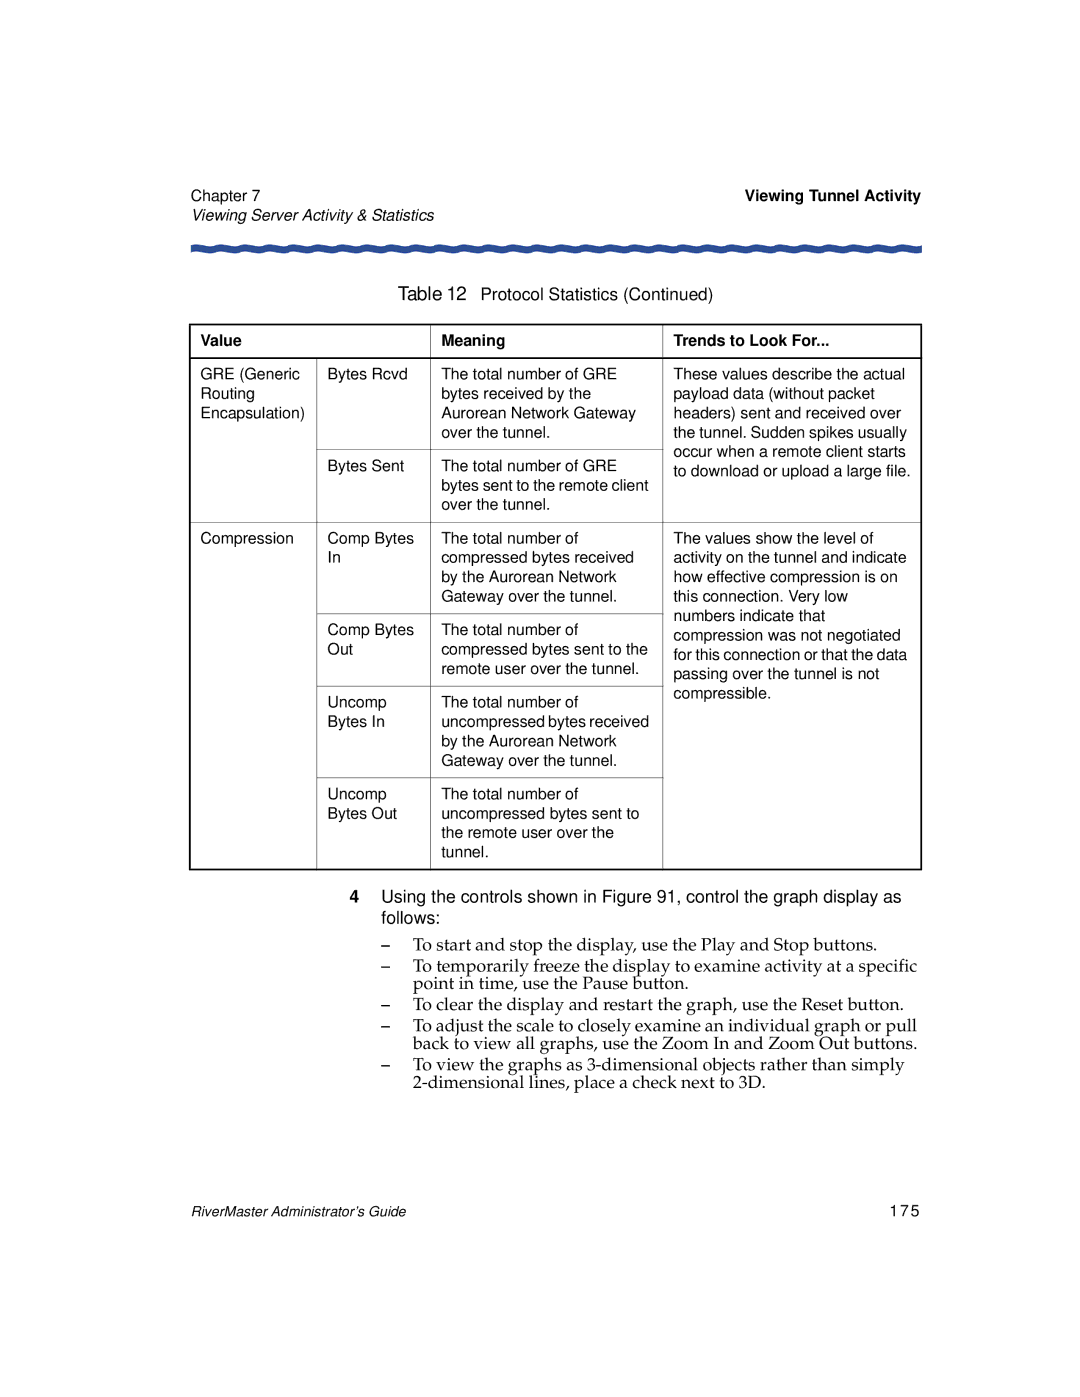
Viewing Tunnel Activity
Tunnel Statistics window appears similar to Figure
Viewing Tunnel Activity
Value Meaning Trends to Look For
Describes the types of statistics you can choose
174
175
176
Using Snmp to Gather Statistics
Generating Reports
Report Contents
Heading Explanation
Report Contents
178
179
Network Gateway Report
180
Network Gateway Report Values
Network Gateway Report
Max Tunnels GRE/IPSEC Display
182
Client Anomaly Report
183
Client Report
184
Client Session Report Values
185
Conn Speed
Client Session Summary Report
Displays a typical Client Session Summary Report
187
Accounting Report
188
Displays a typical Accounting Summary Report
Drill-down Accounting Detail Report
Accounting Summary Report
190
Downloading, Viewing and Exporting Reports
Choose from daily, weekly, monthly or custom options
Downloading, Viewing and Exporting Reports
191
192
Report Viewing Window
193
Printing Reports
194
Exporting Reports
Export window appears as shown in Figure
Select Disk file in the Destination field
195
If you want this export format Go to
196
Choose Export File Window
197
Exporting Records Window
198
Export To Directory window appears as shown in Figure
199
Number and Date Format Dialog box appears as shown
200
Enter Odbc Table Name dialog box appears as shown
201
Select Workbook Window
Format Options Dialog Box
Lines Per Page Dialog Box
203
Exporting Reports to a Microsoft Exchange Folder
Choose Profile Window
Select Exchange Folder in the Destination field and click OK
205
Select a folder window appears as shown in Figure
206
Click on a folder to store the report and click OK
207
Exporting Reports Using Mapi
Export is now complete
Send Mail window appears as shown in Figure
208
209
Glossary
210
AutoLink Recovery
211
Generic Routing Encapsulation GRE
212
Network Administrator
213
Point-to-Point Tunneling Protocol Pptp
214
Remote Client/User
215
TollSaver Database
Page
217
ANG-3000/7000 Preconfiguration Stored on a Floppy Disk
218
Adding Remote Gateways
Add Remote ANG window appears as shown in Figure
Adding Remote Gateways
219
Add Remote ANG Window
220
Configuring ANG IP Addresses
Under Remote Gateways, click Configure Remote Gateway
Remote ANG Configuration screen appears as shown in Figure
221
Configuring Tunnel Protocols
Enter values in the open fields as follows
Click Next
222
Configuring Tunnel Protocols
223
Click on the Authentication tab
224
Click the Encryption tab Do one of the following
225
Compression properties screen appears as shown in Figure
Click the Compression tab
226
227
Enable or disable Mppc as required
228
Configuring Virtual Subnets
229
Configuring Routing Protocols
Configuring Routing Protocols
230
231
232
Ospf Properties
233
Configuring Routing Interfaces
Configuring Routing Interfaces
234
235
236
Configuring RIP for the Interface
237
Set the RIP Route Importing/Exporting options as follows
Configuring Ospf on an Interface
238
239
Creating Static Routes
240
Appendix B
241
Creating Remote Connections
Creating Remote Connections
242
243
Remote Connection Configuration Window
244
Tunnel Values section, enter a User Name
245
246
Loading the Floppy Disk
Loading the Floppy Disk
247
248
Remove the floppy disk
License Grant
Enterasys Networks License Agreement
249
AppendixC
Warranty
250
251
Infringement Indemnification
Limitation of Liability
Appendix C
252
Termination
International Provisions
Applicable Law
253
Government Commercial Computer Software
254
Technical Support
Support from Authorized Resellers
Support from Enterasys Networks
Numerics
Symbols
255
256
Index
New
190-208
257
113
109
111
110
259
48, 224
260
Radius
261
203-206
262
UDP
263