Service Manual
5700A/5720A Series
Multi-Function Calibrator
5/94
LIMITED WARRANTY & LIMITATION OF LIABILITY
Interference Information
Declaration of the Manufacturer or Importer
Bescheinigung des Herstellers/Importeurs
Page
Terms in this Manual
OPERATOR SAFETY SUMMARY
HIGH VOLTAGE
LETHAL VOLTAGE
Use the Proper Fuse
Symbols Marked on Equipment
Power Source
Use the Proper Power Cord
Use Care When Servicing With Power On
SERVICING SAFETY SUMMARY
FOR QUALIFIED SERVICE PERSONNEL ONLY
Do Not Service Alone
Never Accept Ordinary and General Tests for Death
FIRST AID FOR ELECTRIC SHOCK
Free the Victim From the Live Conductor
Get Help
Page
Table of Contents
Introduction and Specifications
Title
Theory of Operation
5700A/5720A Series
±PA Supplies Digital Control
How the DAC is Used in Calibration
Calibration and Verification
Ohms Cal Assembly A9
Calibration Procedure
Using Remote Commands Reserved for Servicing
Maintenance
Troubleshooting
Rear Panel Assembly Access
List of Replaceable Parts
Schematic Diagrams
viii
List of Tables
Unregulated Supplies from the Filter Assembly
A13A1 Oscillator Wideband SMD PCA
A16A1 Power Amplifier Digital Control SIP PCA
Test Record for Flatness Check of the AC 2 mV Range
A11A2 DAC Buffered Reference SIP PCA
5700A/5720A Series
List of Figures
Ohms Main Assembly Simplified Schematic
A15 High Voltage/High Current PCA
Power Amplifier with Calibrator Set to 22V at 1 kHz
5700A/5720A Series
Chapter
Introduction and Specifications
5700A/5720A Series II Calibrator
Service Manual
1-1. Introduction
1-4. How to Use this Manual
1-2. Contacting Fluke
1-3. About this Manual
∙ 5700A/5720A Series II Operator Reference Guide PN
1-5. Additional Instruction Manuals
1-6. Wideband AC Voltage Module Option 5700A-03
∙ 5700A/5720A Series II Getting Started Manual PN
1-9. Support Equipment and Services
1-7. Auxiliary Amplifiers
1-8. 5725A Amplifier
1-13. Wideband AC Module Option 5700A-03 Calibration Support
1-11. 732B-200 Direct Volt Maintenance Program U.S.A. Only
1-10. 732B Direct Voltage Reference Standard
1-12. 742A Series Resistance Standards
1-15. The Components of the 5700A/5720A Series II Calibrator
1-14. Service Centers
Calibrating the 5700A/5720A Series II Calibrator
1-16. Calibrating the 5700A/5720A Series II Calibrator
1-18. Establishing Traceability
1-17. The Calibration Process
1-20. Calibration Check
1-21. Developing a Performance History
1-19. Calibration Reports
1-22. Range Calibration
1-24. Specifications
1-25. Specification Confidence Levels
1-26. Using Absolute and Relative Uncertainty Specifications
Specifications
1-27. Using Secondary Performance Specifications
95% Confidence Level
1-28. DC Voltage Specifications
5720A
99 % Confidence Level
95 % Confidence Level
DC Voltage Specifications
5700A
99 % Confidence Level
Overshoot 5 % Common mode rejection 140 dB, DC to 400 Hz
AC Voltage Specifications
1-29. AC Voltage Specifications
See Volt-Hertz capability in Figure
99 % Conf idence Level
± 5 C from calibration temperature
90 Days
95% Confidence Level
± ppm output + μV
0-10 C and
±ppm output + mV
5725A Amplifier
Figure 1-2. Volt-Hertz Capability
dBm reference 600 Ω
1-30. Resistance Specifications
Resistance Specifications
99% Confidence Level
5700A
active
±1 C Note
Characterized
compensation
I IL
Table 1-13. Current Derating Factors
5720A 95%
1-31. DC Current Specifications
DC Current Specifications
5720A 99%
5700A
Overshoot 5 %
1-32. AC Current Specifications
AC Current Specifications
99 % Confidence Level
95 % Confidence Level
maximum load for full accuracy
Temperature Coefficient Note
± ppm output + nA
V rms
1-35
1-33. Wideband AC Voltage Option 5700-03 Specifications
Wideband AC Voltage Option 5700-03 Specifications
Table 1-22. Wideband AC Voltage Option 5700-03 Specifications
1-34. General Specifications
Guard isolation 20
Size
5205A 220V - 1100 V ac, 0 V - 1100 V dc Overshoot 10 %
1-35. Auxiliary Amplifier Specifications
Auxiliary Amplifier Specifications
5220A AC Current, 180-day specifications
5700A/5720A Series II Calibrator
Theory of Operation
2-36
Theory of Operation
2-155
2-4. Hybrid Reference Amplifiers
2-1. Introduction
2-2. Calibrator Overview
2-3. Internal References
2-7. Digital Section Overview
2-8. Analog Section Overview
2-6. Digital-to-Analog Converter DAC
Figure 2-1. Digital Section Block Diagram
Analog Section Overview
ahp003f.eps
2-10. DC Voltage Functional Description
2-9. Functional Description Presented by Output Function
ahp33f.eps
Figure 2-2. Analog Section Block Diagram, Part
5700/5720A Series II Calibrator
Figure 2-3. Analog Section Block Diagram, Part
2-11. AC Voltage Functional Description
2-12. Wideband AC V Functional Description Option
2-13. DC Current Functional Description
2-14. AC Current Functional Description
2-17. Digital Motherboard Assembly A4
2-16. System Interconnect Detailed Circuit Description
2-15. Ohms Functional Description
2-19. Analog Motherboard Assembly A3
2-18. Transformer Assembly A22
Functional Description Presented by 0utput Function
Figure 2-4. System Interconnections
ahp35f.eps
Figure 2-4. System Interconnections cont
Table 2-1. Analog Motherboard Connectors
Motherboard Connector
Connected to Assembly
2-23. Digital Section Detailed Circuit Description
2-21. Rear Panel Assembly A21
2-22. Filter PA Supply Assembly A18
2-24. Digital Power Supply Assembly A19
Digital Section Detailed Circuit Description
2-25. +5V Power Supply
2-26. ±12V Power Supplies
2-27. +35V Power Supply
2-29. +35V and +75V Shut-Down Circuit
2-28. +75V Power Supply
2-30. CPU Central Processing Unit Assembly A20
2-31. Power-Up and Reset Circuit
2-32. Clock Generation
ahp004f.eps
Figure 2-5. CPU Assembly Block Diagram
Function
Table 2-3. CPU Acronym Glossary
Chip Select
2-33. Watchdog Timer
2-34. Address Decoding and DTACK Data Acknowledge
Table 2-4. CPU Memory Map
2-38. ROM Read-Only Memory
2-37. RAM Random-Access Memory
2-35. Interrupt Controller
2-36. Glue Logic
2-39. Electrically-Erasable Programmable Read-Only Memory EEPROM
2-40. DUART Dual Universal Asynchronous Receiver/transmitter Circuit
2-41. Clock/Calendar Circuit
2-45. Fan Monitor
2-42. Clock Filter Circuit
2-43. CPU to Rear Panel Interface
2-44. CPU to Front Panel Interface
2-49. Decoding and Timing Circuitry
2-46. Front Panel Assembly A2
2-47. Clock Regeneration Circuitry
2-48. Refresh Failure Detect Circuitry
êêêêêêê
2-50. Control Display Circuitry
2-51. Output Display Circuitry
2-53. Knob Encoder Circuitry
2-52. Keyboard Scanner Circuitry
2-54. Led Circuitry
2-55. Keyboard Assembly A1
2-57. Filter/PA Supply A18, Low-voltage Filter/Regulator Section
2-56. Analog Section Detailed Circuit Description
2-61. Triac Circuit
2-58. Unregulated OSC Supplies
2-59. Unregulated LH Supplies
2-60. Unregulated S Supplies
2-65. Filter/PA Supply A18, Power Amplifier Output Supply Section
2-64. FR2 Supplies
2-66. ±PA Supplies Digital Control
ahp005f.eps
Figure 2-6. Power Amplifier Output Supply Simplified Schematic
∙ PA CT is the center tap
2-67. ±250V and ±500V Supplies
2-68. +PA and -PA Supplies
2-69. ±PA Supply Current Limit
2-70. Regulator/Guard Crossing Assembly A17
2-71. Voltage Regulator Circuitry
2-72. Regulated OSC Supplies
+15V +5.975V +5.1V +44.15V +17.000V -17.000V +30.96V +30.96V
2-73. Regulated LH Supplies
2-74. Regulated S Supplies
+15 OSC -15 OSC +5RLH +5LH -5LH +44S -44S +17S -17S 15S +30FR1 +30FR2
2-76. FR2 Supply
2-75. FR1 Supply
2-79. Inguard Memory Configuration
2-77. Guarded Digital Control Circuitry
2-78. Inguard CPU Memory Map
2-83. Break Detection
2-81. Inguard Watchdog Timer
2-82. Power-Up and Reset Circuitry
2-80. Inguard Clock Circuit
2-87. Switch Matrix Assembly A8
2-85. Interface to Guarded Digital Bus
2-86. Inguard CPU Interrupts
2-88. Switch Matrix Digital Control
System Interconnection Detailed Circuit Description
Figure 2-7. Switch Matrix Assembly Simplified Schematic
3. Apply 7V to the relay coils by setting PC5 high
2-89. Switch Matrix Operation 11V DC and 22V DC Ranges
ahp006f.eps
Figure 2-8. Switch Matrix Configuration for 11V DC and 22V DC Ranges
2-91. Switch Matrix Operation 220V AC and DC Ranges
2-90. Switch Matrix Operation 2.2V AC and 22V AC Ranges
ahp007f.eps
Figure 2-9. Switch Matrix Configuration for 2.2V and 22V AC Ranges
ahp008f.eps
Figure 2-10. Switch Matrix Configuration for 220V DC and AC Ranges
2-92. Switch Matrix Operation 2.2V DC Range
ahp009f.eps
Figure 2-11. Switch Matrix Configuration for 2.2V DC Range
2-94. Switch Matrix Operation 220 mV DC Range
2-93. Calibration of the 2.2V Range
To calibrate the offset
ahp010f.eps
Figure 2-12. Calibration of the 2.2V DC Range
ahp011f.eps
Figure 2-13. Switch Matrix Configuration for 220 mV DC Range
2-95. Switch Matrix Operation 220 mV AC Range
2-96. Switch Matrix Operation 2.2 mV and 22 mV AC Ranges
2-97. Calibration of the mV Ranges
ahp012f.eps
Figure 2-14. V AC, 2.2 mV AC, and 22 mV AC Range
ahp013f.eps
Figure 2-15. Divider Calibration
2-98. Internal CAL Zero Amplifier
ahp014f.eps
Figure 2-16. Divider Gain Calibration
2-99. Switch Matrix 5725A Amplifier Interface
2-100. DAC Assembly A11
2-101. Basic DAC Theory of Operation
0.1 x 13V + 0.5 x 0.78 mV =
ahp015f.eps
Figure 2-17. DAC Assembly Simplified Schematic
2-102. DAC Assembly Digital Control
2-103. DAC Assembly Reference Circuitry
Programmable Peripheral Interface IC U31 is the heart of this circuit
2-104. Duty-Cycle Control Circuit
2-105. DAC Filter Circuit
2-106. DAC Output Stage
REFCOM
2-108. Linearity Control Circuit
2-107. Sense Current Cancellation Circuit
2-110. DAC Output Switching
2-109. Negative Offset Circuit
2-111. DAC Buffered Reference Sip
2-112. Calibration Hardware
2-113. ADC Amplifier
2-114. ADC Input Selection
∙ ADC reference voltage ∙ ADC dac ∙ ADC comparator/amplifier
2-115. ADC Circuit
ahp016f.eps
Figure 2-18. ADC Circuit Measurement Functions
2-117. DAC Assembly Calibration
2-116. How the DAC is Used in Calibration
INPUT
2-118. Oscillator Section Overview
2-119. Oscillator Control Assembly A12
2-121. Oscillator Input Switching
2-122. Sense Current Cancellation
2-120. Oscillator Control Digital Control
2-126. Analog Amplitude Control Loop
2-124. Error Integrator
2-123. Averaging Converter
2-125. Three-Pole Filter
ahp017f.eps
Figure 2-19. Oscillator Control Analog Control Loop
2-127. AC/DC Thermal Transfer Circuit
ahp018f.eps
Figure 2-20. AC/DC Thermal Transfer Circuit
2-128. Oscillator Calibration
2-129. AC/DC Frequency Response Characterization
2-130. Oscillator Output Assembly A13
ahp019f.eps
Figure 2-21. Quadrature RC Oscillator Circuit
2-132. Quadrature RC Oscillator
2-131. Oscillator Output Digital Control
2-133. Oscillator Amplitude Control
2-134. Phase−locked Loop
2-135. 2.2V and 22V Range Output Amplifier
2-136. Oscillator Wideband Smd Assembly A13A1
2-138. Phase Shifter
2-139. Power Amplifier Assembly A16
2-137. Output Stage
1. Write the proper data for these relays to port A of the 82C55 U11
2-140. Power Amplifier Digital Control Sip Assembly A16A1
∙ ±185V ∙ ±365V
2-141. PA Common Circuitry
2-142. +PA and -PA Supplies
2-143. PA Input Stage
2-145. PA Output Stage
2-144. PA Mid Stage
2-146. PA Sense Current Cancellation Circuitry
2-147. PA in Standby
2-148. PA Operation 220V DC Range
ahp020f.eps
Figure 2-22. Power Amplifier Simplified Schematic
2-152. High Voltage DC 1100V Range and Current 2.2A Range
2-150. High Voltage Assembly Support Mode
2-149. PA Operation 220V AC Range
2-151. High Voltage AC 1100V Range
2-154. PA Calibration
2-153. 220V DC Internal Calibration Network
ahp021f.eps
Figure 2-23. Power Amplifier DC Calibration Network
Power Amplifier dc gain of approximately -20 is calibrated next. The Power Amplifier is configured as in the 220V dc operation, except the input is connected to the DAC’s 6.5V reference BRF6 and BSRF6 by U2C and U2D respectively. The resulting -130V at the Power Amplifier output is connected to the 175 kΩ end of the internal cal resistor network by relay K3. The 25 kΩ end of this network is connected to DAC OUT HI and DAC SENSE HI by relay K1. The output of the internal cal amplifier is connected to the DAC’s adc circuit as in the previous steps, and the DAC OUTPUT is adjusted until checkpoint is measured by the adc circuit. Since the exact attenuation of the resistor networks is already known, the exact Power Amplifier output voltage can be calculated. This in turn gives the exact Power Amplifier dc gain, since the exact value of 6.5V reference BSRF6 is known
f2-24.eps
Figure 2-24. Power Amplifier Calibration AC Attenuator
2-156. 1100V AC Range
2-155. High Voltage Assemblies A14 and A15
ahp022f.eps
Figure 2-25. High Voltage/High Current Assembly 1100V AC Range
2-158. HVDC Power Supply Filter Circuit
2-157. 1100V DC Range
2-159. HV DC Output Series Pass and Current Limit Circuit
ahp023f.eps
Figure 2-26. High Voltage/High Current Assembly 1100V DC Range
2-161. 2.2A Range
2-160. DC HV Amplifier/AC Sense Buffer
ahp024f.eps
Figure 2-27. High Voltage/High Current Assembly 2.2A AC and DC Ranges
2-162. 2.2A Power Supply Filter Circuit
2-163. High Voltage Digital Control
2-165. Calibration of the AC Function
2-164. High Voltage Calibration
ahp025f.eps
Figure 2-28. High Voltage/High Current Assembly Calibration
2-167. High Voltage Magnitude Control
2-166. Calibration of the Current Function
ahp026f.eps
2-168. Ohms Overview
2-170. Selection of Resistance Values
2-169. Ohms Main Assembly A10
ahp38f.eps
Figure 2-30. Ohms Assemblies Simplified Schematic
Figure 2-31. Ohms Main Assembly Simplified Schematic
Analog Selection Detailed Circuit Description
ahp39f.eps
2-174. Ohms CAL Digital Control
2-171. Ohms Main Assembly Support of Current Function Calibration
2-173. Ohms Cal Assembly A9
2-172. Ohms Digital Control
2-175. 1, 1.9, and Short Resistance
2-176. Two-Wire Ohmmeter Compensation Circuit
ahp027f.eps
Figure 2-32. Two-Wire Lead Drop Compensation Circuit
2-180. Ohms Calibration
2-177. Two-Wire Compensation Power Supplies
2-178. High Side Cancellation
2-179. Low Side Cancellation
ahp028f.eps
Figure 2-33. Calibration to an External 10 kΩ Standard
2-181. Calibrating to the External 10 KW Standard
2-182. Calibrating 10 KW and 19 KW
2-183. Calibrating 100 KW
2-184. Completion of High Resistance Value Calibration
The 10Ω, 19Ω, 100Ω and 190Ω resistance values are determined using 2V from the 2/5/10V source and using internal 101 divider Z5 in conjunction with the DAC. To get 2V, Q2 and Q3 are both turned on, which parallels both the 11.535 kΩ value and the 3.846 kΩ value with the 50 kΩ value. The lower voltage is required to lower the power dissipation in the resistors
ahp029f.eps
Figure 2-34. Ratio Calibration, 10 Ω From 100 Ω
2-185. Calibrating to the External 1W Standard
2-186. Current/High Resolution Oscillator Assembly Overview A7
2-187. Current Section
2-188. Current Input Switching
ahp030f.eps
Figure 2-35. Current Output Simplified Schematic
2-189. Complementary Drive Circuit
2-190. Transconductance Amplifiers
2-191. Shunt Resistors
Table 2-15. Relay Settings for Current Range Selection Range
2-193. Current Output Switching
2-192. Feedback Loop
2-194. Generation of the 2.2A Range
2-197. Current/Compliance Voltage Monitor
2-198. Current Assembly Calibration
2-195. Current Guard Buffer
2-196. Compliance Limiter
ahp031f.eps
Figure 2-36. Current Assembly Calibration
∙ 10.00 Hz to 119.99 Hz ∙ 0.1200 kHz to 1.1999 kHz
2-199. High-Resolution Oscillator Section
2-200. Reference Frequency Amp/Divider
2-201. Phase-Locked Loop
2-203. Hi-Res Output Switching
2-204. Rear Panel Assembly A21
2-202. 5-500k Output Divider
2-205. Rear Panel Power Supplies
2-206. Rear Panel Address Mapping
∙ RPDUARTCS*, D00000-D0001F ∙ RPIEEECS*, D00020-D0002F
2-207. Clock Regeneration Circuit
2-208. IEEE-488 GPIB Interface
2-209. RS-232C Interface
2-212. Phase Lock In/Variable Phase out
2-210. Auxiliary Amplifier Interface
2-211. 5725A Interface
2-213. Rear Panel Relay Control
2-214. Rear Panel CPU Interface
Port A PA0-PA7 provides the input lines for relay driver U16
2-218. Wideband Oscillator Digital Control
2-216. Wideband Oscillator Assembly A6
2-217. Wideband Oscillator Power Supplies
2-215. Wideband AC Module Option
2-219. Phase-Locked Loop and Divider Circuit
2-221. Wideband Oscillator Filters
2-220. Amplitude Control Amplifier and X10 Wideband Amplifier
Figure 2-37 is a simplified schematic for the Wideband Output assembly
2-222. Wideband Output Assembly A5
ahp032f.eps
Figure 2-37. Wideband Output Assembly Simplified Schematic
2-223. Wideband Output Power Amplifier Circuit
2-224. Wideband Output Attenuators
2-225. Wideband Output RMS Sensor and Amplitude Control Circuit
2-226. Wideband Output Overload Control Circuit
2-228. Wideband Output Calibration
2-227. Wideband Output Digital Control
connector is connected back to the OUTPUT HI SENSE and OUTPUT LO SENSE binding posts
5700A/5720A Series II Calibrator
Calibration and Verification
3-30
Calibration and Verification
3-1. Introduction
3-2. Accessing the Fuse
Cleaning the Air Filter
3-3. Cleaning the Air Filter
3-4. Cleaning the Exterior
3-5. Calibration
3-6. Calibrating the 5700A/5720A Series II to External Standards
3-8. When to Adjust the Calibrator’s Uncertainty Specifications
3-7. Calibration Requirements
Calibrating the 5700A/5720A Series II to External Standards
3-9. Calibration Procedure
732B DC STANDARD
4. Enter the ambient temperature then press E. The display shows
5. Connect the 732B to the calibrator as shown in Figure
Figure 3-3. 732B External Calibration Connections
IF3-5.EPS
IF3-6.EPS
IF3-7.EPS
After a few seconds, the following display appears
F7-4.EPS
RESISTANCE STANDARD
CALIBRATOR
Figure 3-4. 742A-1 and 742A-10k External Calibration Connections
16. Set the rear panel CALIBRATION switch to NORMAL
3-10. Range Calibration
4. Press the “DC V” softkey to bring up the next menu shown below
IF057.EPS
PREV MENU
Calibrating the Wideband AC Module Option 5700A-03
3-11. Calibrating the Wideband AC Module Option 5700A-03
2. Press the “Cal “ softkey to bring up the following menu
4. Press the “Gain” softkey to bring up the following display
3-12. Performing a Calibration Check
Press Pto exit the calibration menus
Figure 3-7. Overview of Verification Tests
3-13. Full Verification
3-14. Required Equipment for All Tests
3-15. Warm-up Procedure for All Verification Tests
Equipment Required for Wideband Ac Module Option 5700-03 Verification
Table 3-2. List of Required Equipment for Main Output
Equipment
Application
3-16. Resistance Verification Test
13. The low-value 1Ω, 1.9Ω, and 10Ω tests are summarized in Table
3-17. Two-Wire Compensation Verification
3-18. DC Voltage Verification Test
3-19. DC Voltage One-Tenth Scale Linearity Test
3-20. Direct Current Accuracy Verification Test
3-22. Output Level Tests For AC V Ranges
3-21. AC Voltage Frequency Accuracy Test
Use Table 3-23 5720A or Table 3-24 5700A for the test records
5700A/5720A Series II Output Level
3-23. AC Current Test, 22 mA to 11A Ranges
Table 3-8. 5790A Adjustment Counts
5790A Adjustment Counts
1. Connect the equipment as shown in Figure 3-12A use the 2A shunt
5790A
Figure 3-12. Alternating Current Test Setup
A. Alternating Current Test Setup, 22 mA to 2A Using 5790A Input
B. Alternating Current Test Setup, 10A Using 5790A Input
Pomona Cable 1362-A-18
3-24. AC Current Test, 2 mA and 200 μA Ranges
Hi Output Lo
Metal Film Resistor Mounted on Dual Banana Plug 200
3-25. Rationale for Using Metal-Film Resistors to Measure AC Current
Figure 3-14. Metal Film Resistor Equivalent Circuit
Figure 3-15. Metal Film Resistor in Test Circuit
3-27. Wideband AC Voltage Module Output Verification
3-26. Wideband Frequency Accuracy Test
Wideband Output Accuracy at 1 kHz Test
3-28. Wideband Output Accuracy at 1 kHz Test
3-29. Wideband Output Flatness Test
3-30. Wideband Flatness Calibration Procedure
3-32. DC Voltage Load Regulation Test
3-31. Optional Tests
3-33. DC Voltage Linearity Test
3-34. DC Voltage Output Noise 10 Hz to 10 kHz Test
Optional Tests
2. Set the Oscilloscope Differential Amplifier controls as shown below
WWarning
3-37. Wideband Distortion Testing
3-35. DC Voltage Output Noise 0.1 to 10 Hz Test
3-36. AC Voltage Distortion Test
3-38. AC Voltage Overshoot Test
3-39. Minimum Use Requirements
Calibration Equipment
Minimum Use Specifications
Minimum Use Requirements
Table 3-15. Minimum Use Requirements
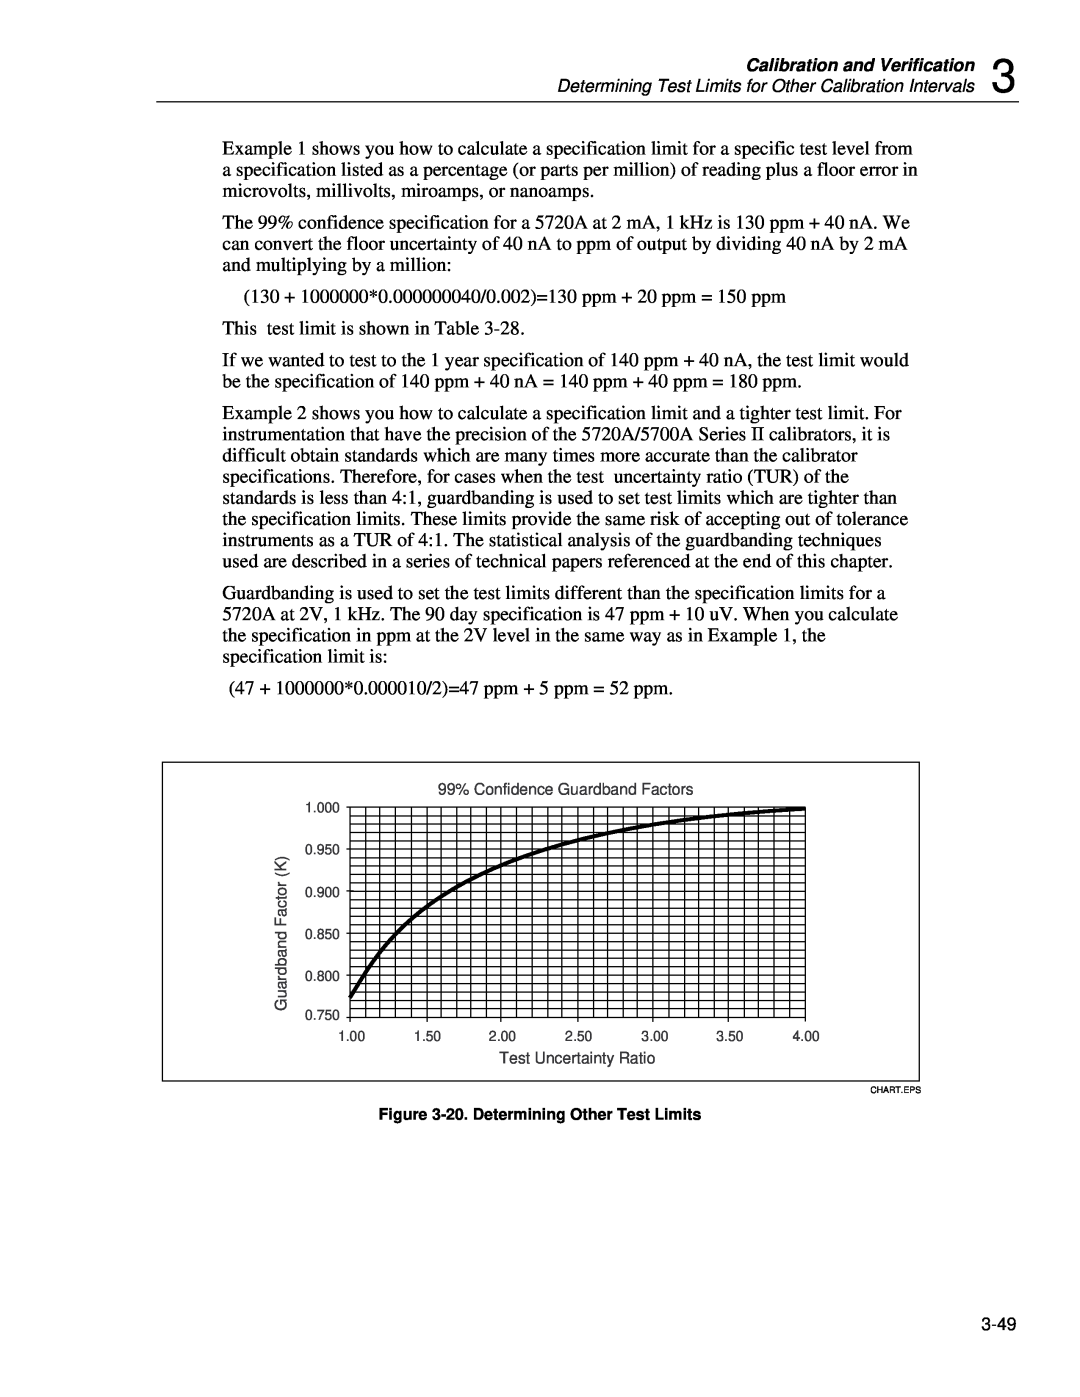
3-40. Determining Test Limits for Other Calibration Intervals
130 + 1000000*0.000000040/0.002=130 ppm + 20 ppm = 150 ppm
Measured 1Ω Std Voltage
DMM Error
1Ω Std Res Value
1Ω Std Voltage
Table 3-16. 5720A Resistance Test Record cont
DMM UUT Res Value
UUT True Res Value
UUT True Res
Table 3-17. 5700A Resistance Test Record
UUT 1Ω Displayed Value
UUT 1Ω Voltage
Difference of Characterized to Nominal Value
Table 3-17. 5700A Resistance Test Record cont Max
5720A Output
Divider Setting
Table 3-18. DC Voltage Test Record for 5720A
5720A Range
Table 3-19. DC Voltage Test Record for 5700A
5700A Range
5700A Output
Table 3-20. Direct Current Accuracy Test Record 5720A
UUT Error
Setting
Error A+B
DC DMM Reading
Table 3-21. Direct Current Accuracy Test Record 5700A
5725A Amplifier DC Current Test
Test Limit 90-day ppm
Level
Error Display Reading
Table 3-23. 5720A AC Voltage Output Test Record
Output
Display
Error
Output Level
Table 3-23. 5720A AC Voltage Test Record cont
Table 3-24. 5700A AC Voltage Output Test Record
Limits
Table 3-24. 5700A AC Voltage Output Test Record cont
Table 3-25. AC Voltage 2 mV Range Test Record
Characterized 1.9 mV Reading
2A, 200 mA, 20 mA and 10A Test Record
UUT Error Display
Calculated Error
Table 3-26. 5720A AC Current 20 mA to 10A Accuracy Test Record
Table 3-27. 5700A AC Current 20 mA to 10A Accuracy Test Record
2A, 200 mA, 20 mA and 10A Test Record 10A Only for 5725A
Specs ±ppm
Test Limits ± ppm
Table 3-28. 5720A AC Current 2 mA and 200 μA Accuracy Test Record
Spec ± ppm 90-day
5790A Transfer Spec ± ppm
Tolerance Limits
Table 3-30. Wideband Frequency Accuracy Test Record
Frequency Hz
Frequency Measured
5790A 1-Year Spec ± ppm
Measured Error
Measured Flatness Error
Table 3-31. Wideband Accuracy at 1 kHz Test Record
Table 3-32. Wideband Flatness Test Record cont
Error Sum ppm
Table 3-33. Wideband Absolute Error 10 Hz to 500 kHz
1 kHz Absolute Error ppm
Flatness Error ppm
5700A/5720A Series Range
Div. Setting
Kelvin-Varley Setting
Table 3-34. Load Regulation Test Record
Load Resistors
UUT Error Display Reading
Table 3-37. AC V Distortion Test Summary
5700A/5720A Series II Output
A Message From
static awareness
Fluke Corporation
5. USE STATIC SHIELDING CONTAINERS FOR HANDLING AND TRANSPORT
Title
Maintenance
5700A/5720A Series II Calibrator
4-1. Introduction
4-2. Cleaning the Air Filter
4-9. Rear Panel Removal and Installation
4-3. General Cleaning
4-4. Cleaning PCA’s
4-5. Access Procedures
4-10. Rear Panel Assembly Access
4-12. Display Assembly Removal and Installation
4-11. Front Panel Removal and Installation
4-14. Analog Assembly Removal and Installation
4-13. Keyboard Assembly Removal and Installation
FRONT PANEL
Figure 4-5. Analog and Digital Assemblies
4-17. Hybrid Cover Removal
4-18. Front/Rear Binding Post Reconfiguration
4-15. Digital Assembly Removal and Installation
4-16. Power Transformer Removal and Installation
6. Install the Front Panel
4-19. Installing a Wideband AC Module Option
4-21. Replacing the Clock/Calendar Backup Battery
4-20. Clearing Ghost Images from the Control Display
ETIME
4-22. Using Remote Commands Reserved for Servicing
4-23. Using the ETIME Command
Using The Fatality? and Fatalclr Commands
FATALITY?
FATLCLR?
Response
5700A/5720A Series II Calibrator
Troubleshooting
5700A/5720A Series II Calibrator
2703 A7 8255 Port C Fault
5-2. Interpreting Diagnostic Fault Codes
2701 A7 8255 Port a Fault
2702 A7 8255 Port B Fault
2709 A7 Current Magnitude Fault
2705 A7 Oven Regulation Fault
2706 A7 Current Compliance Fault
2707 A7 Hardware Initialization Fault
2714 A7 Hi-res Loop In 1kHz Range
2718 Fault In Setting Up AC For Diagnostics
2719 A7 8255 Was Reset
2713 A7 Hi-Res Loop In 100Hz Range
2804 A11 DAC Heaters Not Regulated
2801 A11 8255 Port a Wires
2802 A11 8255 Port B Data Bus
2803 A11 8254 Status Words
2811 A11 -11V DC Range Fault
2808 A11 ADC Amp Gain Error
2809 A11 DAC Monitoring Fault
2810 A11 +11V DC Range Fault
2818 Assembly A11 Missing
2815 A11 6.5V Reference Fault
2816 A11 13V Buffered Reference Fault
2817 A11 13V Reference Fault
3102 A14 8255 Port B Fault
2822 A8/A11 -11/22V DC Zero Estimate Fault
2826 A11 A/D Overload Fault
3101 A14 8255 Port a Fault
3106 A15 DC HV Amp Noise Fault
3103 A14 8255 Port C Fault
3104 A15 HV Oven Regulation Fault
3105 A15 HV I Oven Regulation Fault
3112 A15 HV +DC Ref/error Amplitude Fault
3109 A15 HV +DC Preamplifier Fault
3110 A15 HV +DC Series Pass & Current Fault
3111 A15 HV +DC High Voltage Output Fault
3119 A14/A15 HV +DC Current Abs. Value
3116 A15 HV -DC Reference/error Amp Fault
3117 A14/A15 HV +DC Current Error Amp Fault
3118 A14/A15 HV -DC Current Error Amp Fault
3124 A14/A15 HV AC 1kHz, Preamp Hi
3126 A14/A15 HV AC 100Hz, Preamp Fault
3122 A14/A15 HV AC 1kHz, Preamp Lo
3123 A14/A15 HV AC 1kHz, Preamp Mid
3131 A14/A15 HV AC 100Hz, Output Lo
3128 A14/A15 HV AC 1kHz, Output Lo
3129 A14/A15 HV AC 1kHz, Output Mid
3130 A14/A15 HV AC 1kHz, Output Hi
3134 Spare
3135 Assembly A14 Not Responding
3136 A14 8255 Was Reset
3137 A14/A15/A16 2.2A AC Range Mag. Fault
3141 A14/A15/A16 2.2A DC Range Dummy Load
3301 A9 8255 Port a Fault
3302 A9 8255 Port B Fault
3140 A14/A15/A16 2.2A AC Range Abs. Value
3306 A9 2V Source Fault
3303 A9 8255 Port C Fault
3304 A9 10V Source Fault
3305 A9 5V Source Fault
3312 A9/A10 Ohms 11 Divider Fault
3309 A9 Diff Amp Gain Fault
3310 A9 Diff Amp Noise Fault
3311 A9/A10 Ohms 101 Divider Fault
3318 A9/A10 190 Kilohm Ratio Fault
3315 A9/A10 10 Ohm Cal Diag Fault
3316 A9/A10 19 Ohm Cal Diag Fault
3317 A9/A10 100 Kilohm Ratio Fault
3326 A9/A10 19 Kilohm Check Fault
3321 A9/A10 10M Ohm Ratio Fault
3324 A9/A10 100M Ohm Ratio Fault
3325 A9/A10 10 Kilohm Check Fault
3330 A9/A10 190 Ohm Check Fault
3327 A9/A10 1 Kilohm Check Fault
3328 A9/A10 1.9 Kilohm Check Fault
3329 A9/A10 100 Ohm Check Fault
3337 A9/A10 Ohms Correction Factor Fault
3334 A9/A10 1.9 Ohm Check Fault
3335 A9/A10 Ohms Short Check Fault
3336 A9/A10 2 Wire Compensation Fault
3402 A12 8255 Port B
3341 A9/A10 190 Ohm Cal Diag Fault
3400 A12 8255 Control Word
3401 A12 8255 Port A
3412 A12 To A13 Interface Fault
3408 A13 Fixed Ampl. Osc Fault
3409 A13 Phase Lock Loop Fault
3410 A12/A13 22V Amp Bias Adj Error
3414 A12/A13 Nonlinear Control Loop 2vrng
3416 A12/A13 DAC 15th Bit Fault
3417 A12 DC Sensor Buffer Fault
3418 A12 Sensor Loop/SQ. Root Amp Fault
3426 A12 8255 Was Reset
3423 Assembly A12 Missing
3424 Assembly A13 Missing
3425 Assembly A12 Or A13 Not Responding
3504 Spare
3508 A16/A14 220V AC Range Output Fault
3510 A16 220V Amp Fault
3503 A16 8255 Port C
3513 Spare
3520 A16 PA Oven Regulation Fault
3511 A16 Incorrect PA Input
3512 Spare
3526 220V AC Initialization Fault
3521 Assembly A16 Is Not Responding
3524 A16 Power Amp Is Too Hot
3525 220V DC Initialization Fault
3602 +15S Supply Fault
3530 A16 8255 Was Reset
3600 +17S Supply Fault
3601 -17S Supply Fault
3608 +5rLH Supply Fault
3605 -42S Supply Fault
3606 LH Com Ground Fault
3607 -5lH Supply Fault
3614 OSC Com Ground Fault
3611 -PA Supply Fault
3612 +15 OSC Supply Fault
3613 -15 OSC Supply Fault
3703 A21 8255 Port C Fault
3615 S Com Ground Fault
3701 A21 8255 Port A Fault
3702 A21 8255 Port B Fault
3804 A8 Zero Amp Lo Noise Fault
3801 A8 8255 Port A Fault
3802 A8 8255 Port B Fault
3803 A8 8255 Port C Fault
3814 A8 220mV Divider Fault 3815 A8 22mV Divider Fault 3816 Spare
3809 A8 Zero Amp Hi Gain Fault
3810 A8 2.2V Amp Noise Fault 3811 A8 Zero Amp Offset
3812 A8 2.2V Gain Fault 3813 A8 220mV Offset Fault
3827 Assembly A8 Too Hot 3900 A5 8255 Control Word
3824 A8 Oven Regulation Fault
3825 Assembly A8 Not Responding
3826 A8 8255 Was Reset
3908 A5 Rms Sensor At 30MHz
3905 A6 Phase Lock Loop At 10MHz
3906 A6 Phase Lock Loop At 30MHz
3907 A5 Rms Sensor At 10MHz
3912 A5/A6 Output Offset At 10MHz
3914 A5 0DB Output Attenuation Fault
3915 A5 10DB Output Attenuation Fault
3911 A5/A6 Ampl. Control At 30MHz
3922 A5/A6 Wideband Initialization Fault
3916 A5 20DB Output Attenuation Fault
3917 A5 30DB Output Attenuation Fault
3918 A5 40DB Output Attenuation Fault
5-3. Component-level Troubleshooting
3923 A5 8255 Was Reset
5-4. Troubleshooting the Wideband Output Assembly A5
Component-level Troubleshooting
All measurements are referenced to SCOM TP16 or TP17 and all
5-5. Troubleshooting the Wideband Oscillator Assembly A6
F5-2.EPS
Figure 5-2. Waveform at TP1
F5-3.EPS
Figure 5-3. Waveform at TP15
F5-4.EPS
Figure 5-4. Waveform at Pins 14 and 15 of U1
F5-5.EPS
10 ms
5-7. Current Section
5-6. Troubleshooting the Current/Hi-Res Assembly A7
F5-6.EPS
Figure 5-6. Waveform at Pin 11 of K2
K10, K13
Figure 5-7. Waveform at Pin 6 of K2
1.2 Ω
K5C, K5D
F5-10.EPS
F5-9.EPS
F5-11.EPS
All measurements are referenced to LHCOM TP18
5-8. Hi-Res Oscillator Section
F5-13.EPS
Figure 5-13. Waveform at TP12
5-9. Troubleshooting the Switch Matrix Assembly A8
F5-15.EPS
Figure 5-15. Waveform at TP16
5-11. Two-wire Compensation Circuit
5-10. Troubleshooting the Ohms Cal Assembly A9
5-12. Troubleshooting the Ohms Main Assembly A10
5-13. Troubleshooting the DAC Assembly A11
F5-18.EPS
Figure 5-17. Waveform at TP6
Figure 5-18. Waveform at TP4, Calibrator Set to
F5-17.EPS
F5-19.EPS
Figure 5-19. Waveform at TP4, Calibrator Set to
F5-20.EPS
Figure 5-20. Waveform at TP7
F5-21.EPS
Figure 5-21. Waveform at TP5
5-14. Duty-cycle Control Circuit
F5-22.EPS
Figure 5-22. Waveform at Pin 10 of U6
F5-24.EPS
Figure 5-23. Waveform at Pin 6 of U13
Figure 5-24. Waveform at Pin 4 of U10
F5-23.EPS
U11, Q30, Q31, Q32, and their associated components
5-15. ADC Circuit
5-16. Buffered Reference SIP Assembly A11A2
5-17. Troubleshooting the Oscillator Control Assembly A12
F5-28.EPS
Figure 5-27. Waveform at Anode of CR4
Figure 5-28. Waveform at Pin 6 of U11
F5-27.EPS
F5-29.EPS
Figure 5-29. DC Sense Buffer Waveform TP6
5-18. Troubleshooting the Oscillator Output Assembly A13
∙ TP5 positive voltage ∙ TP4 negative voltage ∙ TP3 positive voltage
5-19. Troubleshooting the High Voltage Control Assembly A14
F5-31.EPS
Figure 5-31. Waveform at TP3
5-20. Magnitude Control Circuit
5-21. Troubleshooting the High Voltage/High Current Assembly A15
operation refer to Figure 2-25 in the Theory of Operation section. During normal operation in the 1100V ac mode, internal software monitors the output and makes corrections or trips the instrument into standby. This internal monitoring can cause difficulty when troubleshooting a faulty High Voltage assembly. If during the next step 8 the instrument keeps tripping into standby, defeat the monitoring by connecting a jumper from TP9 to TP10 on the DAC assembly
Figure 5-32. Waveform at Pin 18 of Hybrid H4
5-22. Troubleshooting the Power Amplifier Assembly A16
Figure 5-33. Power Amplifier with Calibrator Set to 22V at 1 kHz
Remove any jumpers left in place from step 8 before continuing
AC elsewhere in the Calibrator
5-23. Troubleshooting the Filter/PA Supply Assembly A18
J201. The +PA supply at +180Vshould go into current limit. The oscilloscope should show a repeating pattern in which the +PA supply climbs to about +180V then drops to 0V. If a failure is detected, check Q203, VR246, VR213, U201C, and associated components
5700A/5720A Series II Calibrator
List of Replaceable Parts
5700A/5720A Series II Calibrator
6-3. Manual Status Information
6-2. How to Obtain Parts
A * symbol indicates a device that may be damaged by static discharge
6-1. Introduction
Fluke
6-5. Service Centers
Manual Status Information Assembly Name
Ref or Option No
Fluke Stock No
Service Centers
Table 6-1. Front Panel Final Assembly
Reference Description Designator
Figure 6-1. Front Panel Final Assembly
5700A-T&B
f6-1.eps
Table 6-1. Chassis Final Assembly
f61a1.eps
Figure 6-2. Chassis Final Assembly
5700A T&B
1 of
f61a2.eps
Figure 6-2. Chassis Final Assembly cont
Table 6-1. Rear Panel Final Assembly
f61b.eps
Figure 6-3. Rear Panel Final Assembly
LED,GREEN,SUBMINIATURE
ISOLATOR,OPTO,OPTICAL SWITCH,INFRARED
Table 6-2. A1 Keyboard PCA
CR1-4 DT1, DT2 W1
Figure 6-4. A1 Keyboard PCA
5700A-1603
Designator
Table 6-3. A2 Front Panel PCA
Table 6-3. A2 Front Panel PCA cont
5700A-1602
Figure 6-5. A2 Front Panel PCA
57001602.EPS
Table 6-4. A3 Analog Motherboard PCA
Figure 6-6. A3 Analog Motherboard PCA
5700A-1601
Table 6-5. A4 Digital Motherboard PCA
5700A-1605
Figure 6-7. A4 Digital Motherboard PCA
57001605.EPS
Table 6-6. A5 Wideband Output PCA, Option
Table 6-6. A5 Wideband Output PCA, Option -03 cont
R69,R70 R72,R73,R80-83 R74 R75 R78,R79,R86-89 R92-95 R96-99 R100 R101
5700A-1611
Figure 6-8. A5 Wideband Output PCA, Option
57001611.EPS
Table 6-7. A6 Wideband Ocillator PCA, Option
Table 6-7. A6 Wideband Ocillator PCA, Option -03 cont
CONNECTOR ,CONN,DIN41612,TYPE C,RT ANG,64 PIN
R58,R112,R212 R312,R412,R512 R59 R61 R62,R64,R65,R69 R63 R68 R71
5700A-1610
Figure 6-9. A6 Wideband Oscillator PCA, Option
57001610.EPS
Table 6-8. A7 Current/High-Res Oscillator PCA
Table 6-8. A7 Current/High-Res Oscillator PCA cont
Designator
5700A-1621
Figure 6-10. A7 Current/HIgh-Res Oscillator PCA
57001621.EPS
Reference Designator
Table 6-9. A8 Switch Matrix PCA
Table 6-9. A8 Switch Matrix PCA cont
Figure 6-11. A8 Switch Matrix PCA
5700A-1622
57001622.EPS
Table 6-10. A9 Ohms Cal PCA
Table 6-10. A9 Ohms Cal PCA cont
5700A-1631
Figure 6-12. A9 Ohms Cal PCA
57001631.EPS
Table 6-11. A10 Ohms Main PCA
5700A-1630
Figure 6-13. A10 Ohms Main PCA
57001630.EPS
C110,C111 CR1,CR3-6,CR8, CR12,CR13 CR2
Table 6-12. A11 DAC PCA
Table 6-12. A11 DAC PCA cont
Service Centers
VR13 VR18,VR22 VR25 VR26 VR27 VR28 VR29 VR33,VR34 X1 Z2 Z4 Z5 Z8 Z10
5700A-1640
Figure 6-14. A11 DAC PCA
57001640.EPS
Table 6-13. A11A1 DAC Filter SIP PCA
Figure 6-15. A11A1 DAC Filter SIP PCA
5700A-1643
Table 6-14. A11A2 DAC Buffered Reference SIP PCA
Figure 6-16. A11A2 DAC Buffered Reference SIP PCA
5700A-1644
Table 6-15. A12 Oscillator Control PCA
Stock
Table 6-15. A12 Oscillator Control PCA cont
5700A/5720A Series II Calibrator
5700A-1650
Figure 6-17. A12 Oscillator Control PCA
57001650.EPS
Table 6-16. A13 Oscillator Output PCA
Table 6-16. A13 Oscillator Output PCA cont
Table 6-16. A13 Oscillator Output PCA cont
5700A-1651
Figure 6-18. A13 Oscillator Output PCA
57001651.EPS
Table 6-17. A13A1 Oscillator Wideband SMD PCA
Figure 6-19. A13A1 Oscillator Wideband SMD PCA
5700A-1652
Table 6-18. A14 High Voltage Control PCA
Table 6-18. A14 High Voltage Control PCA cont
5700A-1661
Figure 6-20. A14 High Voltage Control PCA
57001661.EPS
Table 6-19. A15 High Voltage/High Current PCA
Table 6-19. A15 High Voltage/High Current PCA cont
5700A-1660
Figure 6-21. A15 High Voltage/High Current PCA
57001660.EPS
CR20,CR21,CR23
Table 6-20. A16 Power Amplifier PCA
R9,R10,R16,R33, R40,R50 R59, R115,R148 R149 R11,R12
Table 6-20. A16 Power Amplifier PCA cont
5700A/5720A Series II Calibrator
Figure 6-22. A16 Power Amplifier PCA
5700A-7670
57001670.EPS
Table 6-21. A16A1 Power Amplifier Digital Control SIP PCA
5700A-1671
Figure 6-23. A16A1 Power Amplifier Digital Control SIP PCA
Table 6-22. A17 Regulator/Guard Crossing PCA
Table 6-22. A17 Regulator/Guard Crossing PCA cont
5700A-1680
Figure 6-24. A17 Regulator/Guard Crossing PCA
57001680.EPS
CR1,CR2,CR04, CR5 CR8,CR10, CR12,CR13
Table 6-23. A18 Filter/PA Supply PCA
Table 6-23. A18 Filter/PA Supply PCA cont
VR211,VR217 VR227,VR231 VR212,VR216 VR226,VR232 VR214,VR230
5700A-7690
Figure 6-25. A18 Filter/PA Supply PCA
57001690.EPS
C24,C25 CR1-4,CR9-12 CR8,CR16, CR21- 24,CR29-34
Table 6-24. A19 Digital Power Supply PCA
Table 6-24. A19 Digital Power Supply PCA cont
Figure 6-26. A19 Digital Power Supply PCA
5700A-1604
57001604.EPS
Table 6-25. A20 CPU PCA
Ref Des
Part Number
Table 6-26. A20 CPU PCA cont
57001606.EPS
Figure 6-27. A20 CPU PCA
Table 6-27. A21 Rear Panel PCA
Table 6-27. A21 Rear Panel PCA cont
5700A-1609
Figure 6-28. A21 Rear Panel PCA
57001609.EPS
5700A/5720A Series II Calibrator
Schematic Diagrams
5700A/5720A Series II Calibrator
Figure 7-1. A1 Keyboard PCA
Schematic Diagrams
Figure 7-1. A1 Keyboard PCA cont
5700A/5720A Series
Figure 7-2. A2 Front Panel PCA
Figure 7-2. A2 Front Panel PCA cont
Figure 7-2. A2 Front Panel PCA cont
Schematic Diagrams
Service Manual
5700A/5720A Series
Figure 7-2. A2 Front Panel PCA cont
Figure 7-2. A2 Front Panel PCA cont
Figure 7-3. A3 Analog Motherboard PCA
Figure 7-23. A3 Analog Motherboard PCA cont
Figure 7-3. A3 Analog Motherboard PCA cont
Figure 7-3. A3 Analog Motherboard PCA cont
Schematic Diagrams
Service Manual
Figure 7-4. A4 Digital Motherboard PCA
Figure 7-4. A4 Digital Motherboard PCA cont
ahp46f.tif
Service Manual
Figure 7-5. A5 Wideband Output PCA Option
5700A-1611
Figure 7-5. A5 Wideband Output PCA Option -03 cont
Figure 7-5. A5 Wideband Output PCA Option -03 cont
Schematic Diagrams
Service Manual
7-23
5700A-7610
Figure 7-6. A6 Wideband Oscillator PCA Option
Figure 7-6. A6 Wideband Output PCA Option
Figure 7-6. A6 Wideband Oscillator PCA Option -03 cont
Service Manual
5700A-1621
Figure 7-7. A7 Current/High-Resolution Oscillator PCA
Figure 7-7. A7 Current/High-Resolution Oscillator PCA cont
Figure 7-7. A7 Current/High-Resolution Oscillator PCA cont
Schematic Diagrams
Service Manual
Oscillator PCA cont
Figure 7-7. A7 Current/High-Resolution
7-31
5700A-1021 4 of
5700A-1622
Figure 7-8. A8 Switch Matrix PCA
Figure 7-8. A8 Swith Matrix PCA cont
Figure 7-8. A8 Switch Matrix PCA cont
Figure 7-8. A8 Swith Matrix PCA cont
Schematic Diagrams
Service Manual
Figure 7-8. A8 Switch Matrix PCA cont
5700A/5720A Series
Figure 7-8. A8 Swith Matrix PCA cont
5700A-1631
Figure 7-9. A9 Ohms Cal PCA
Figure 7-9. A9 Ohms Cal PCA cont
Service Manual
5700A/5720A Series
Figure 7-9. A9 Ohms Cal PCA cont
Figure 7-9. A9 Ohms Cal PCA cont
Schematic Diagrams
Service Manual
Figure 7-10. A10 Ohms Main PCA
Figure 7-10. A10 Ohms Main PCA cont
Figure 7-10. A10 Ohms Main PCA
Schematic Diagrams
Service Manual
5700A/5720A Series
Figure 7-10. A10 Ohms Main PCA cont
Figure 7-10. A10 Ohms Main PCA
5700A-7640
Figure 7-11. A11 DAC PCA
Figure 7-11. A11 DAC PCA cont
200K
22uF
R128
C112
Figure 7-11. A11 DAC PCA cont
7-52
Figure 7-11. A11 DAC PCA cont
Schematic Diagrams
Service Manual
Figure 7-12. A11A1 DAC Filter SIP PCA
Figure 7-13. A1142 DAC Buffered Reference SIP PCA
Figure 7-14. A12 Oscillator Control PCA cont
5700A-7650
DG211
4. C5 AND C55 ARE NOT INSTALLED
3. ALL GND CONNECTIONS DENOTED WITH
A 1 ARE BUSSED AND CONNECTED TO GND3 AT ONE POINT
Figure 7-14. A12 Oscillator Control PCA cont
7-60
Figure 7-15. A13 Oscillator Output PCA
Figure 7-15. A13 Oscillator Output PCA cont
Figure 7-15. A13 Oscillator Output PCA cont
Schematic Diagrams
Service Manual
Figure 7-16. A13A1 Oscillator Wideband SMD PCA
Figure 7-16. A13A1 Oscillator Wideband SMD PCA cont
Figure 7-17. A14 High Voltage Control PCA
Figure 7-17. A14 High Voltage Control PCA cont
7-68
Figure 7-17. A14 High Voltage Control PCA cont
Service Manual
5700A/5720A Series
Figure 7-17. A14 High Voltage Control PCA cont
Figure 7-17. A14 High Voltage Control PCA cont
5700A-1660
Figure 7-18. A15 High Voltage/ High Current PCA
Figure 7-18. A15 High Voltage/High Current PCA cont
Service Manual
5700A-7670
Figure 7-19. A16 Power Amplifier PCA
4. NOT INSTALLED
Figure 7-19. A16 Power Amplifier PCA cont
10 M 2N4044
7-78
Figure 7-19. A16 Power Amplifier PCA cont
Figure 7-20. A16A1 Power Amplifier Digitial Control SIP PCA
Figure 7-20. A161A1 Power Amplifier Digital
7-80
Control SIP PCA cont
Figure 7-21. A17 Regulator/Guard Crossing PCA
5700A-1680
Figure 7-21. A17 Regulator/Guard Crossing PCA cont
Figure 7-21. A17 Regulator/Guard Crossing PCA cont
7-84
5700A-7690
Figure 7-22. A18 Filter/PA Supply PCA
Figure 7-22. A18 Filter/PA Supply PCA cont
Service Manual
Figure 7-23. A19 Digital Power Supply PCA
Figure 7-23. A19 Digital Power Supply PCA cont
Figure 7-24. A20 CPU PCA
Figure 7-24. A20 CPU PCA cont
Figure 7-24. A20 CPU PCA cont
Schematic Diagrams
Service Manual
5700A/5720A Series
Figure 7-24. A20 CPU PCA cont
Figure 7-24. A20 CPU PCA cont
Schematic Diagrams
Service Manual
Figure 7-25. A21 Real Panel PCA
Figure 7-25. A21 Rear Panel PCA cont
Figure 7-25. A21 Rear Panel PCA cont
Schematic Diagrams
Service Manual
5700A/5720A Series
Figure 7-25. A21 Rear Panel PCA cont
Figure 7-25. A21 Rear Panel PCA cont
Schematic Diagrams
Service Manual
Figure 7-26. Hybrids
Figure 7-26. Hybrids cont
Figure 7-26. Hybrids cont
Schematic Diagrams
Service Manual
5700A/5720A Series
Figure 7-26. Hybrids cont
Figure 7-26. Hybrids cont
Schematic Diagrams
5700A/5720A Series
Service Manual