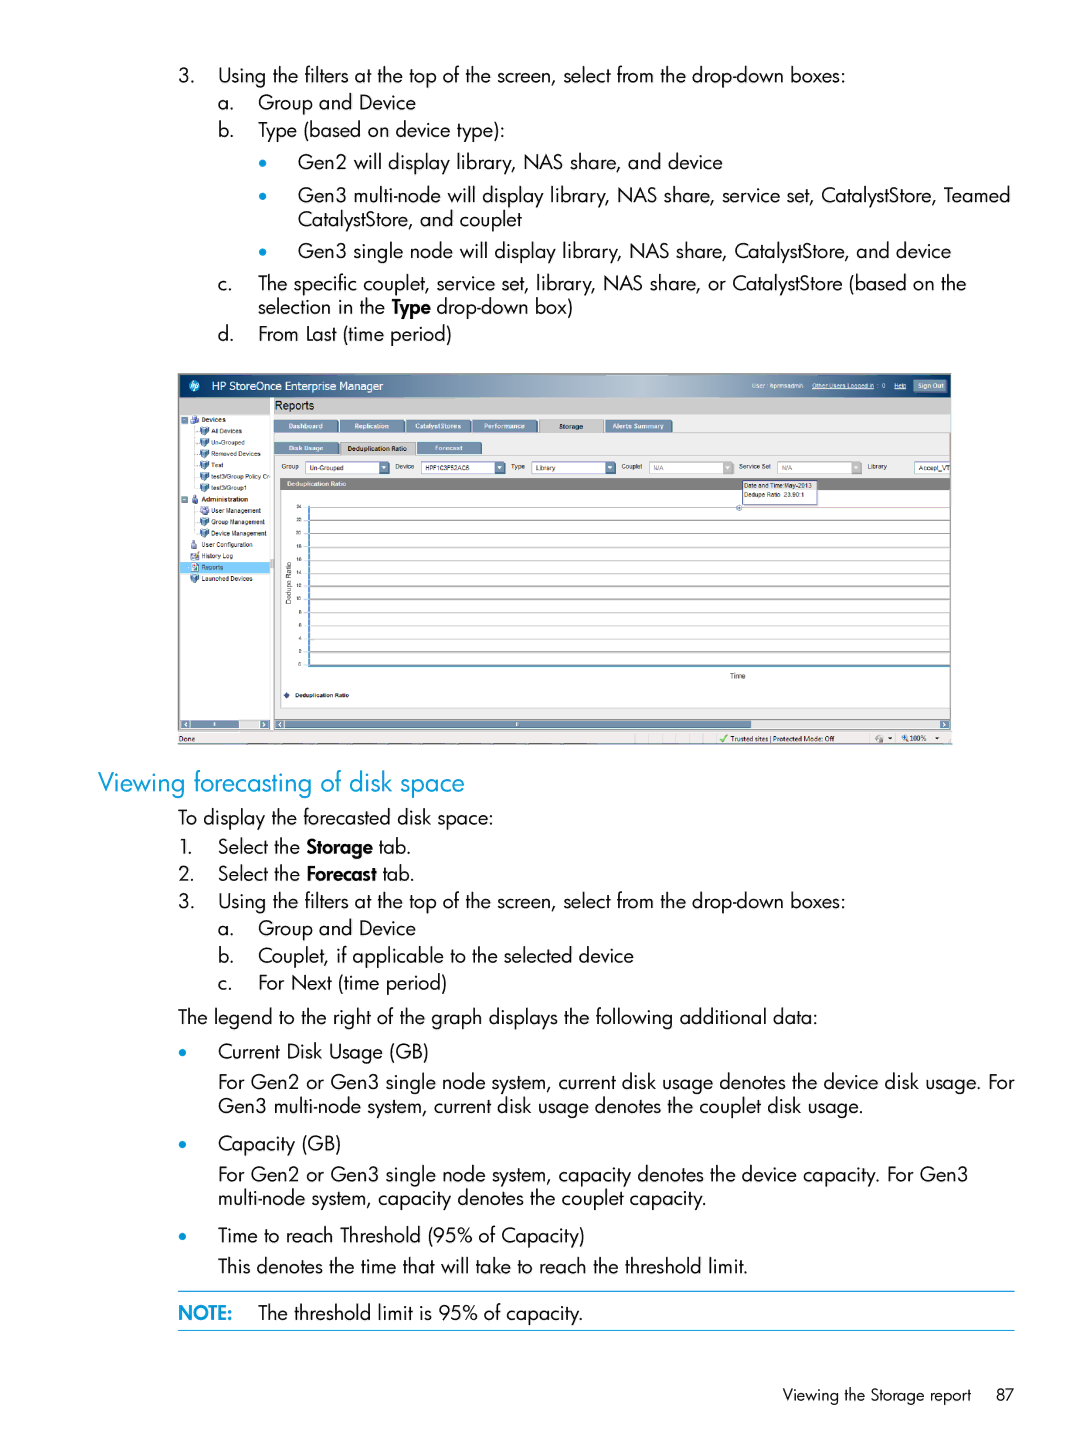
3.Using the filters at the top of the screen, select from the
a.Group and Device
b.Type (based on device type):
•Gen2 will display library, NAS share, and device
•Gen3
•Gen3 single node will display library, NAS share, CatalystStore, and device
c.The specific couplet, service set, library, NAS share, or CatalystStore (based on the selection in the Type
d.From Last (time period)
Viewing forecasting of disk space
To display the forecasted disk space:
1.Select the Storage tab.
2.Select the Forecast tab.
3.Using the filters at the top of the screen, select from the
a.Group and Device
b.Couplet, if applicable to the selected device
c.For Next (time period)
The legend to the right of the graph displays the following additional data:
•Current Disk Usage (GB)
For Gen2 or Gen3 single node system, current disk usage denotes the device disk usage. For Gen3
•Capacity (GB)
For Gen2 or Gen3 single node system, capacity denotes the device capacity. For Gen3
•Time to reach Threshold (95% of Capacity)
This denotes the time that will take to reach the threshold limit.
NOTE: The threshold limit is 95% of capacity.
Viewing the Storage report | 87 |