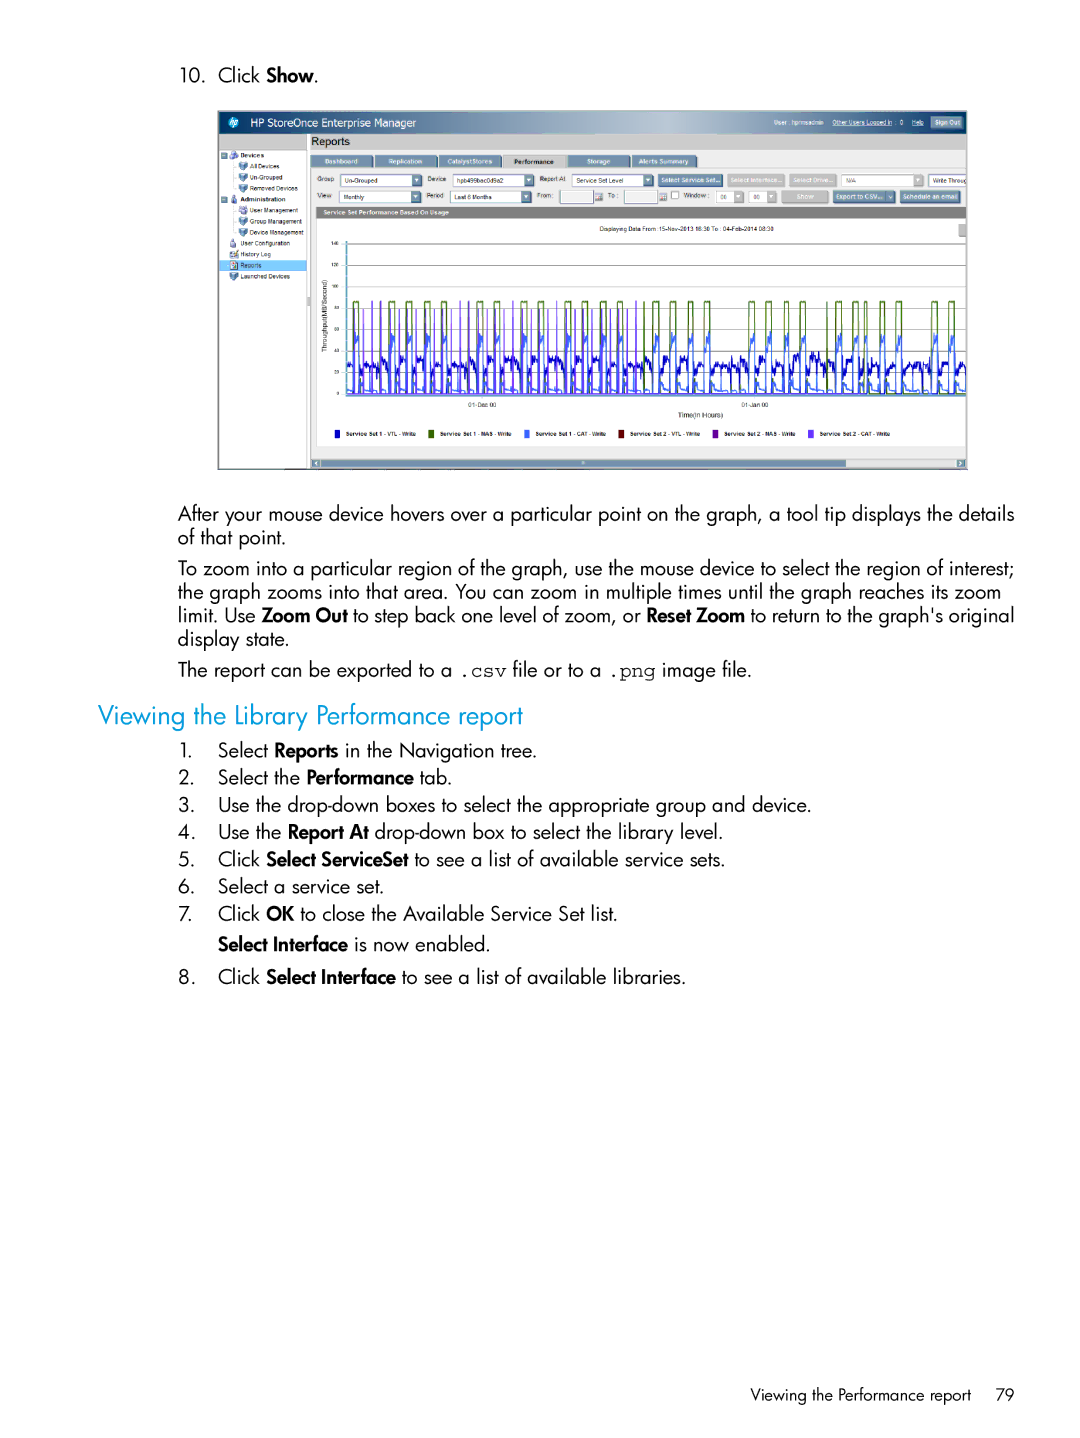
10. Click Show.
After your mouse device hovers over a particular point on the graph, a tool tip displays the details of that point.
To zoom into a particular region of the graph, use the mouse device to select the region of interest; the graph zooms into that area. You can zoom in multiple times until the graph reaches its zoom limit. Use Zoom Out to step back one level of zoom, or Reset Zoom to return to the graph's original display state.
The report can be exported to a .csv file or to a .png image file.
Viewing the Library Performance report
1.Select Reports in the Navigation tree.
2.Select the Performance tab.
3.Use the
4.Use the Report At
5.Click Select ServiceSet to see a list of available service sets.
6.Select a service set.
7.Click OK to close the Available Service Set list. Select Interface is now enabled.
8.Click Select Interface to see a list of available libraries.
Viewing the Performance report | 79 |